

Being a Linux user, I can relate to your fascination with CPUs.
There are times when you want to know every detail of your computer. How many cores are there? Is it virtual or physical processor? Who is the manufacture? And much more.
So, how do you get CPU details in Linux?
Well, In this tutorial, I will walk you through how you can find three critical aspects of yor CPU:
- Getting CPU details
- What's the current CPU usage per core
- Know the CPU temperature
So let's start with the first one.
Find CPU details in Linux
The easiest way to get the CPU details in Linux is to use the lscpu command. And the best part is it does not require any installation.
To know every detail of your CPU, simply execute the lscpu command as shown here:
lscpu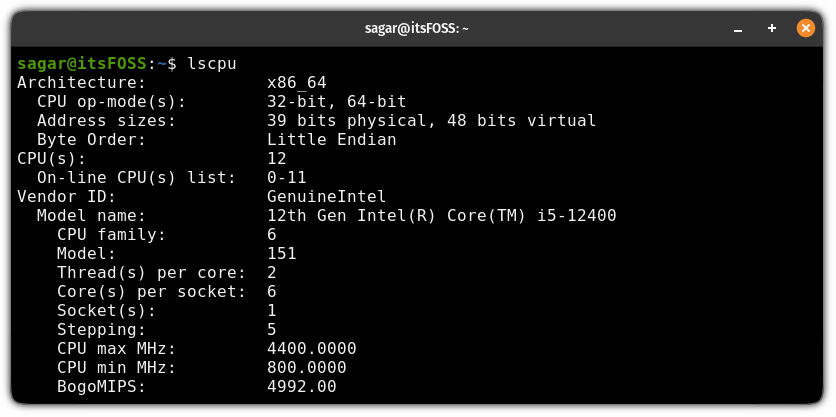
Let's break down the output one by one.
Architecture: This indicates the CPU architecture which is x86_64 indicating my CPU is 64-bit.CPU op-mode(s): It shows what kind of processes your computer can handle. As I'm running a 64-bit processor, I can run 32-bit and 64-bit processes.Address sizes: It specifies the memory capabilities of your system.- 39 bits physical: CPU can directly address physical RAM up to 512 512 terabytes.
- 48 bits virtual: CPU can manage virtual memory up to 256 petabytes.
Byte Order: Shows the order in which the bytes are arranged. Little Endian means byte with the least significance comes first.CPU(s): Total number of cores including the logical and physical cores.On-line CPU(s) list: It indicates all the cores from 0 to 11 are available and online.Vendor ID: Shows the name of the CPU manufacturer.Model name: As the name suggests, it shows the name of your CPU.CPU family: Indicates the family group of the processor.Model: Shows the internal model number of the processor.Thread(s) per core: A number of threads that each core can handle. In my case, it is 2 so each physical core can utilize 2 threads at once.Core(s) per socket: Shows the number of the physical core on your system.Socket: Number of physical CPU sockets on your system.Stepping: Number of revisions done to your CPU model.CPU maxandCPU min: It shows the highest and lowest clock speeds of your CPU.BogoMips: Bogus Millions of Instructions Per Second is a retired and unreliable measurement of CPU speed. It is often seen in the older system.Virtualization: Shows what technology your CPU is using for virtualization. If you're an Intel user, then you'll seeVT-x.Caches (sum of all): This section shows the size and level of cache:- L1d: Data cache
- L1i: instruction cache
- L2: L2 cache
- L3: L3 cache
NUMA node(s): NUMA nodes are a group of CPU cores and memory modules that are physically close together and share a local memory controller.NUMA node0 CPU(s): it indicates that I have a single NUMA node named node0 and all cores reside within the same NUMA code.
Want a GUI tool instead? CPU-X could be what you are looking for.
 Anuj Sharma
What else do you need?
Find the current CPU usage per core
You can always use the top command to check the CPU utilization. However the htop command is a little better tool than top. It shows CPU usage for each core and in a better, friendly interface.
But it does not come pre-installed on most Linux distributions.
So here, I will show you how to install and use the htop to monitor the current CPU usage.
For Ubuntu users:
sudo apt install htopFor Fedora users:
sudo dnf install htopFor Arch Linux:
sudo pacman -S htopOnce you are done with the installation, you can start the htop using the following:
htop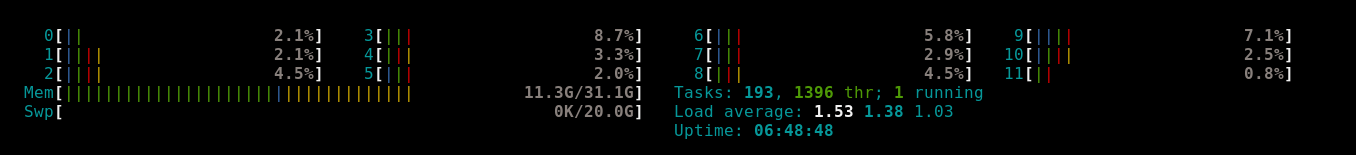
As you can see, it shows how each core is utilized along with the memory consumption and total number of tasks running in your system.
If you want something specifically for CPU utilization, give s-tui a try.
Sagar Sharma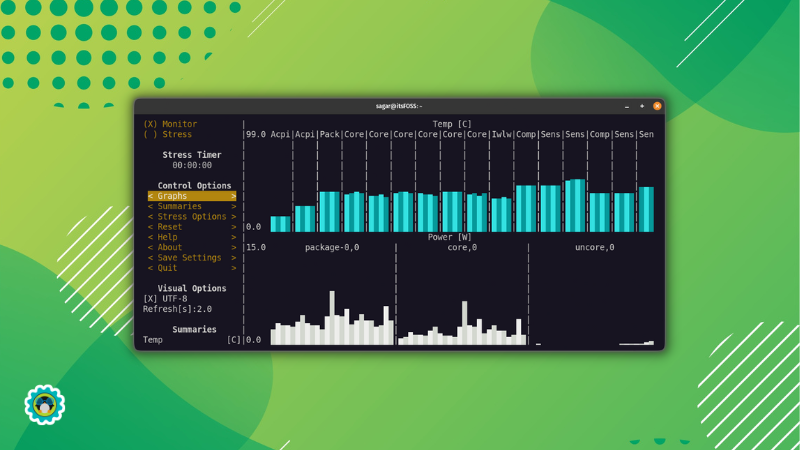
Find CPU temperature in Linux
To find the CPU temperature, all you need is a utility called lm-sensors and here's how to install on various Linux distributions:
For Ubuntu/Debian users:
sudo apt install lm-sensorsFor Fedora:
sudo dnf install lm_sensorsFor Arch:
sudo pacman -S lm_sensorsOnce you are done with the installation, execute the following command and it will show the temperature of the CPU:
sensors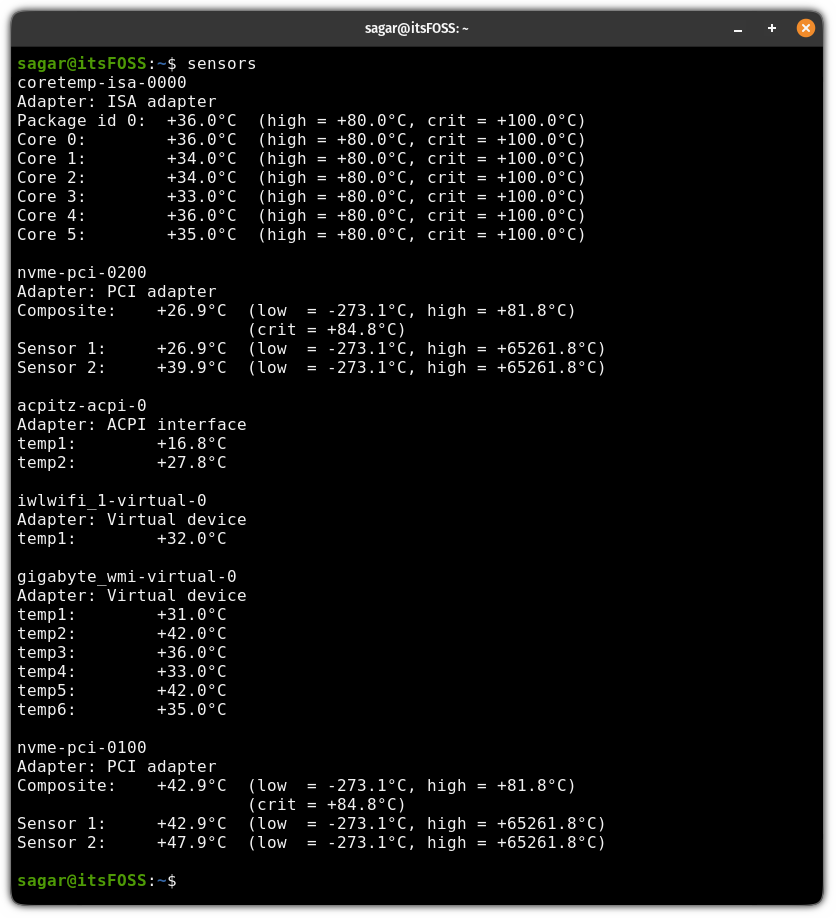
Wrapping Up
In this tutorial, I went through how you can get CPU details using the lscpu command and have also mentioned how you can check the CPU usage and temperatures.
There are many more tools to get system hardware details in Linux. I used the most common ones here.
Abhishek Prakash
I hope you will find this quick tip helpful. Let me know if you have any questions.
If this helped you, consider supporting It's FOSS
It's FOSS has been helping people use Linux for the past 14 years. Help us stay independent from big tech. Become a Plus member, enjoy ad-free reading and get 5 eBooks.