
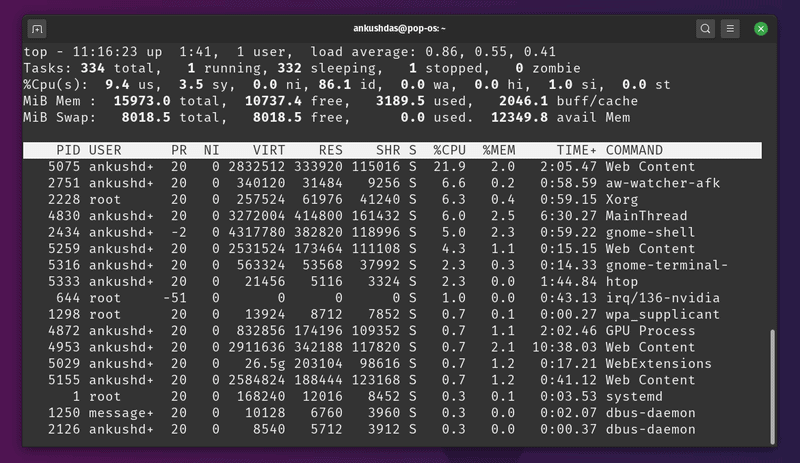
No matter whether you’re a system administrator or just a casual desktop user, you may have heard about one of the most popular terminal-based system monitoring tool “top“. To many, it’s the task manager on Linux.
In case you didn’t know, the “Top” utility helps display all the running processes and gives you some important information on the performance of your personal computer or server. It also gives you the ability to kill processes that you don’t need.
But, what alternatives do you have? Do you need any? Let’s find out.
Why do you need “Top” Alternatives?
Considering that you’ll find it baked in on most of the Linux distribution by default, top isn’t going anywhere.
However, you won’t find any mouse support, scroll support, no colors to highlight things, and a few other cons. For these reasons, using top command to its fullest is not easy for everyone.
There are alternatives which provide you more information on the running processes and let you manage them easily.
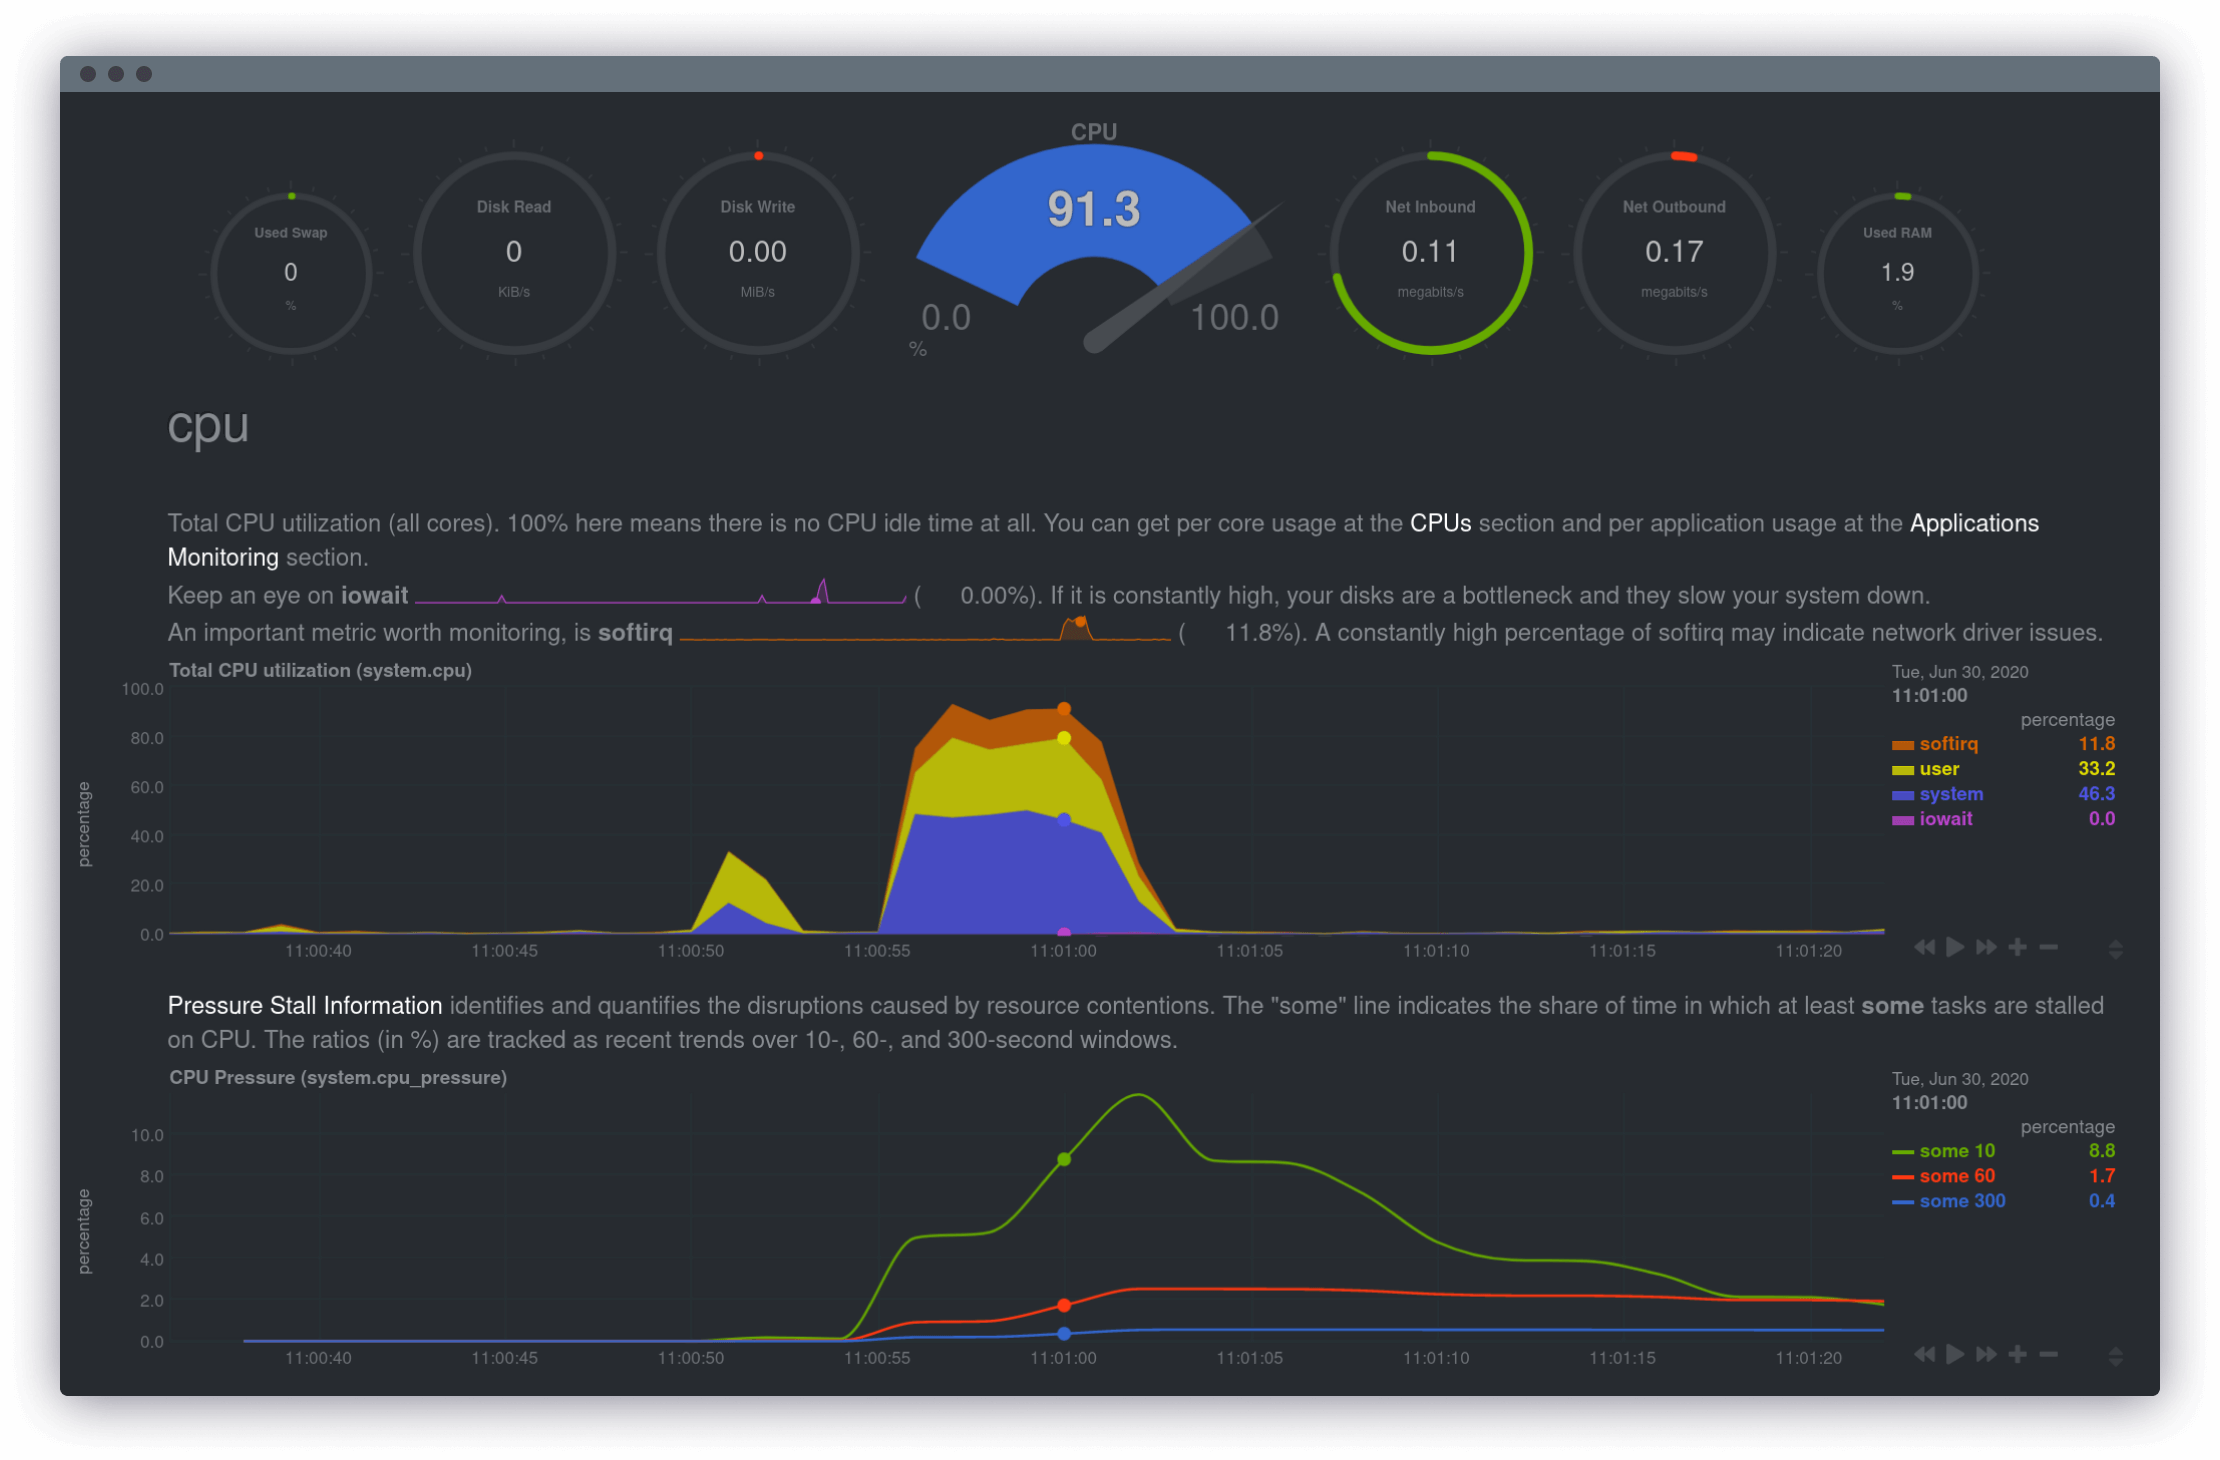
Take Netdata for example. This open source monitoring tool also offers free cloud-based monitoring. You can see the history of system resources consumption in your account. You may even get journal logs here. Absolutely mind blowing.

But here, I will be talking about command line based that functions similar to the top command.
Useful system monitoring tools like top (but better than top)
Hence, in this article, I’ll mention a few good alternatives to the top command utility that are potentially better.
I have included installation commands for Debian/Ubuntu based distributions. Almost all the tools mentioned here should be available via the package manager of other distributions as well.
The list is in no particular order of ranking. Try what’s best for you!
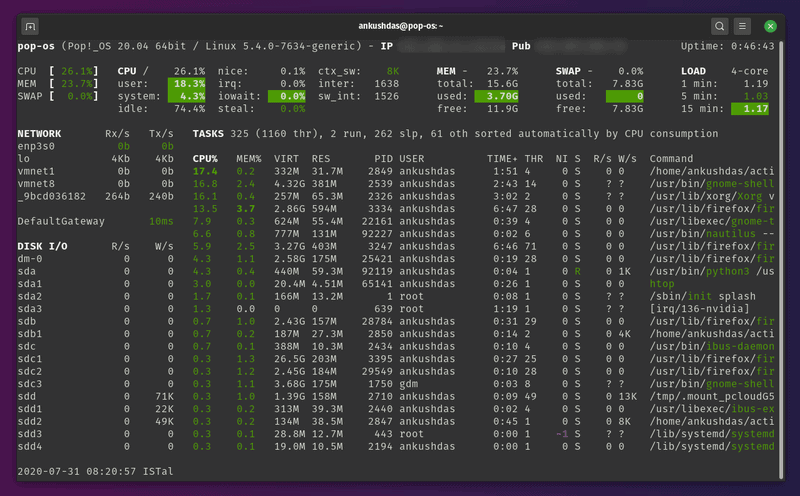
1. htop
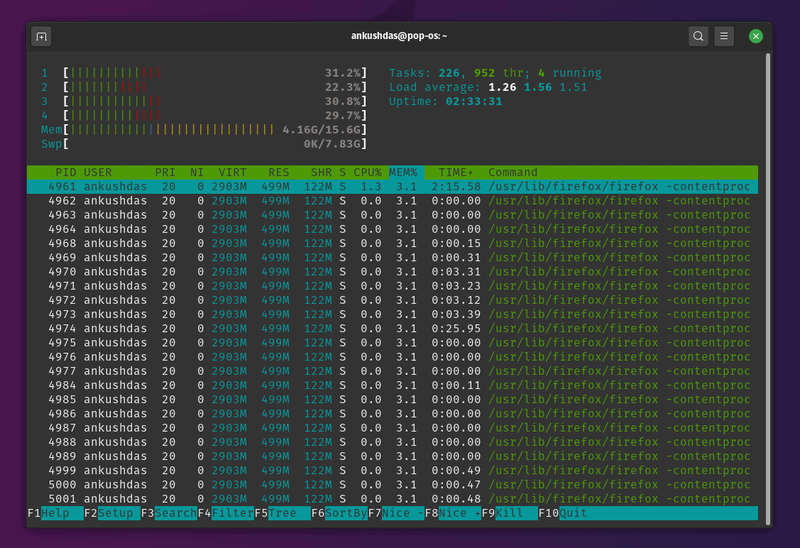
htop is an interactive system monitor that supports scrolling and mouse interaction as well.
Not just limited to the advanced features — but it also highlights the processes and information using some color codes which makes it look more organized and easy to work with.
In fact, I personally prefer using htop over top to keep an eye on the system resources and the processes. It lets you kill processes, filter them, offers tree view of processes (press F5), and a couple of other features.
How to install htop?
For Ubuntu-based distros, you just have to head to the terminal and type in:
sudo apt install htopYou can also find RPM/DEB packages from the links on their official website for other Linux distributions. In either case, you can also download the source if you want.
2. atop
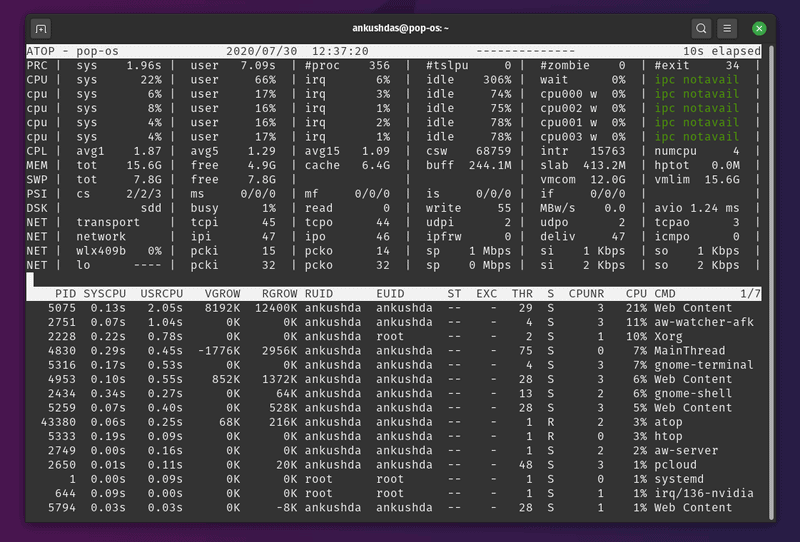
If you want more details on the running processes or the ones that were previously running, atop is a useful utility for that.
It also supports permanent logging of resource utilization if you want it for long-term analysis. Even though I’m not a professional system administrator, it’s easy to say how useful it is to see the critical resource being highlighted.
In my case, I’d prefer htop over this — but it depends on what information you’re looking to monitor and what are the extra features that you want. You can learn more about it on its official website.
How to install atop?
If you’re on a Debian-based distro, you just have to type in:
sudo apt install atopYou can also find .rpm packages listed for every version on their official download page. In case you’re looking to install it on other Linux distros, you should refer to its official web page.
3. nmon
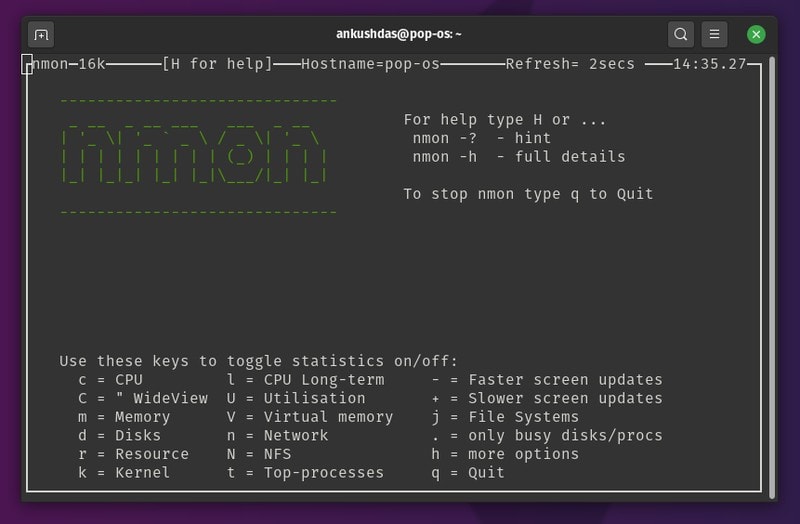
nmon is yet another useful utility that lets you monitor system resources and processes.
Unlike some other options, it gives you control to break down the information and display them one by one (toggle them) as needed
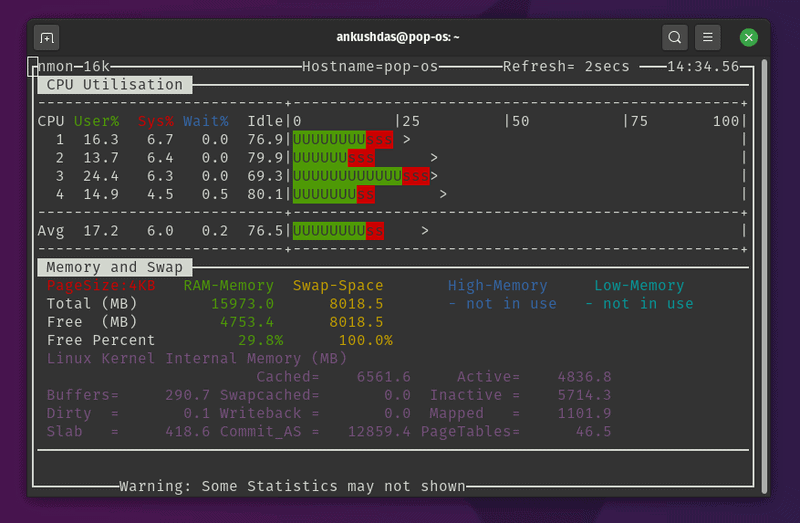
As you can observe in the screenshots above, you have to press specific keys to toggle stats and look through them. The stats are color-coded as well, which makes them easy to go through.
How to install nmon?
For Ubuntu-based distros, you can simply type in:
sudo apt install nmonIn either case, you can head to its official download page and look for packages for other Linux distros.
4. vtop
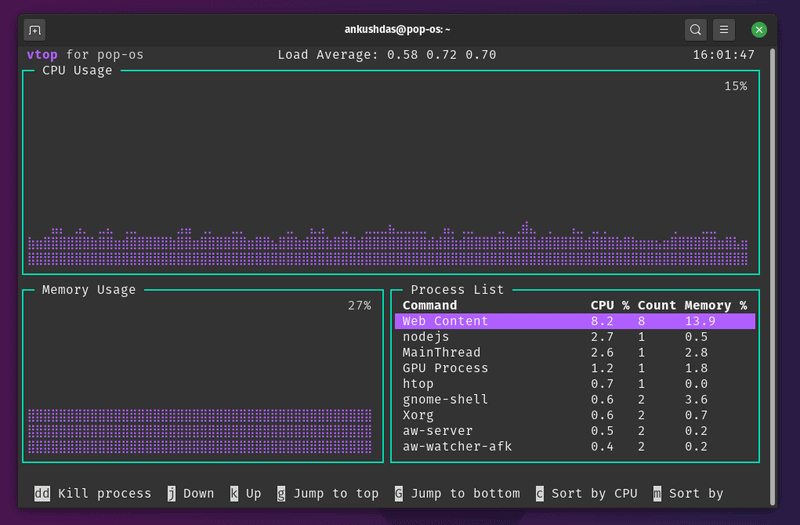
vtop is an interesting utility to monitory system resources while having the ability to manage them as well.
Unlike others, it is written using node.js. So, you’ll need to install node.js and npm packages.
It does offer mouse support and it looks like a GUI in a terminal. You can disable the mouse control if you don’t need it. So, it makes things easier to understand and monitor. Also, you can customize the vtop theme pretty easily.
How to install vtop?
For Ubuntu-based distros, you need to enter the following commands in the terminal
sudo apt install nodejs
sudo apt install npm
sudo npm install -g vtop
Here, you’re installing nodejs and its package manager npm first. Next, with the third command, you’re actually installing vtop.
If you want to install it on other Linux distributions, you can refer to its GitHub page.
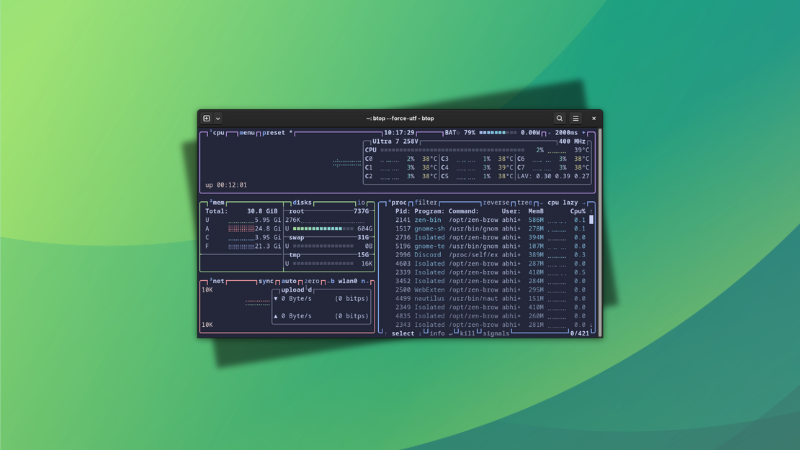
5. bashtop
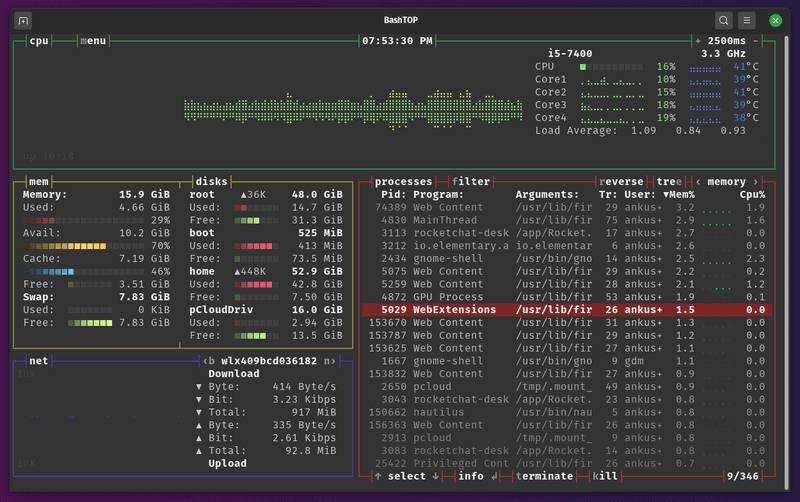
An impressive top alternative which potentially needs more resources to run — but easy-to-use and looks better in my opinion.
I’m starting to think that I should use bashtop instead of htop for monitoring.
In addition to the information it offers by default, you can also add more modules if you also want CPU temperatures and other stats using bashtop.
You can get all the details on it at its GitHub page.
How to install bashtop?
For some reason, it isn’t available in the default repository of Ubuntu 20.04 – but if you have Ubuntu 20.10 or later, you can simply type in:
sudo apt install bashtopFor Ubuntu 20.04 or lower (any Ubunty-based distro), you can simply add the PPA and get it installed using the following commands:
sudo add-apt-repository ppa:bashtop-monitor/bashtop
sudo apt update
sudo apt install bashtop
To get installation instructions for other Linux distributions, you can check out the GitHub page.
There is a C++ version of bashtop available in the form of btop++.
6. gtop
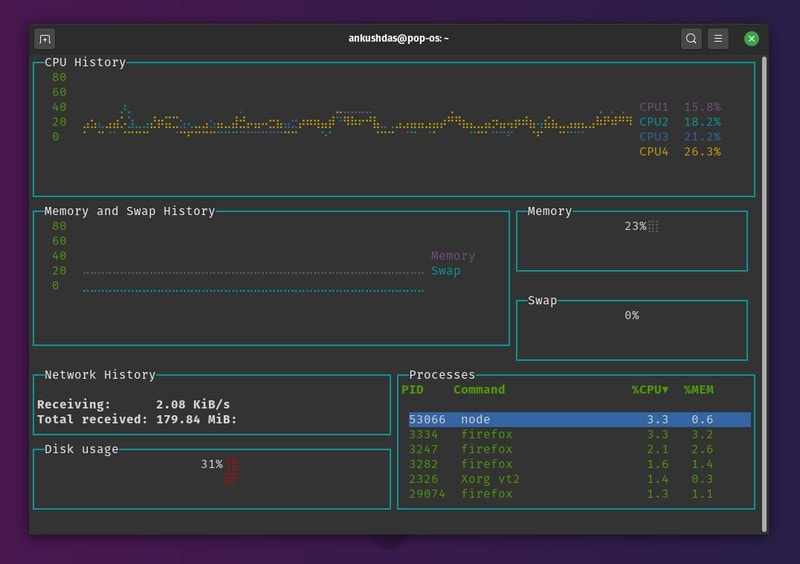
Yet another impressive top alternative. It looks somewhat similar to vtop and also requires nodejs to be installed.
You don’t get much to customize here — but it’s easy to use and provides all the necessary information.
How to install gtop?
Similar to vtop, you need to install nodejs and npm package manager to get started on Ubuntu-based distros.
Just type in the following commands in the terminal to get it installed:
sudo apt install nodejs
sudo apt install npm
sudo npm install -g gtop
If you need to install it on any other Linux distro, you can refer to its GitHub page.
7. Glances
Glances is an amazing system monitoring tool for folks who need to have more information at a single place.
The information you’ll have on your screen will depend on the size of the window. So, you should expect all the essential stats for disk I/O, network, kernel version, sensors, and other information.
You can also export the stats to an external database and use a web interface to monitor remotely. This is particularly useful for the system administrators making a custom web dashboard of sorts.
How to install Glances?
For Ubuntu-based distros, you can simply type in:
sudo apt install glancesIf you’re looking to install it on other Linux distributions, you can refer to its official website where you should find an auto install script or just explore its GitHub page.
How about Some GUI Tools?
Enough of those terminal-based system monitoring tools! There are also some really great GUI (Graphical User Interface) tools that get the job done.
8. Mission Center
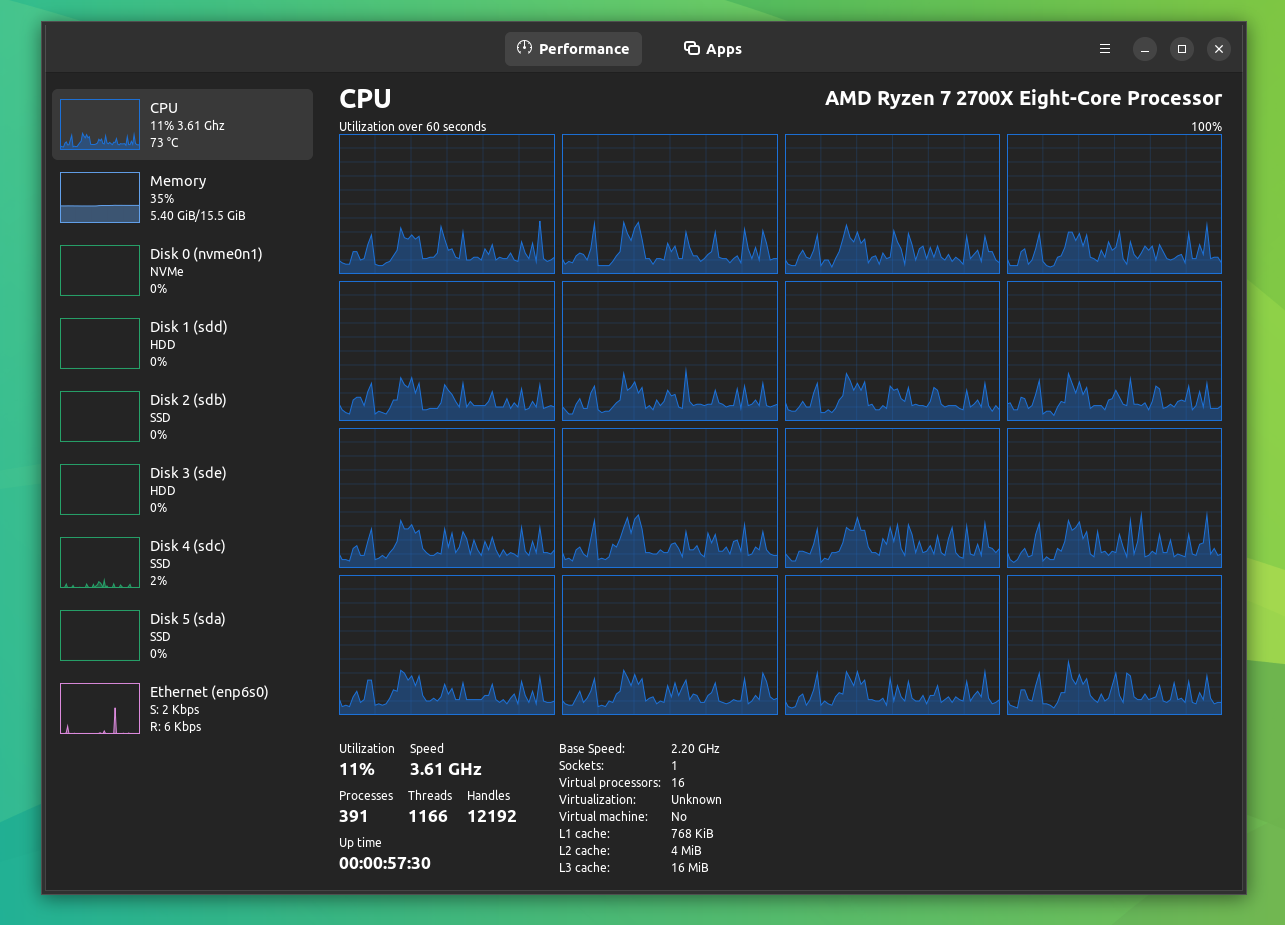
I recently came across Mission Center in an article on our news portal. It is a Rust-based system monitoring app for Linux that lets you perform real-time monitoring of your hardware.
With this, you can monitor your Memory, Disk, Network, CPU, and even your GPU. It can also serve up detailed apps/process usage information when you go into the “Apps” tab.
Some of you might find it familiar, it is mainly because this app takes design cues from the task manager found on Windows 11.
How to install Mission Center?
You can grab the latest Mission Center release from the Flathub store. If you are interested in manually building from source, then you can refer to its GitLab repo.
If you have a Flatpak-enabled system, then you could run:
flatpak install flathub io.missioncenter.MissionCenterThen, to launch the app:
flatpak run io.missioncenter.MissionCenter9. Netdata
Dubbed as “the open-source monitoring platform everyone needs”, Netdata is a potent system monitoring tool that gives its users comprehensive levels of data access.
You also get to take advantage of things like low-latency monitoring, intuitive dashboards, a high level of data privacy, and a very lightweight footprint of about <2% CPU usage, and 150 MB of RAM.
How to install Netdata?
As this is geared towards advanced users, I suggest you first go through the official documentation. For getting access to Netdata, you will have to sign up for an account on the official website.
If you are interested in the source code, then head to its GitHub repo.
There are (always) more...
There are more and much more powerful monitoring tools and services out there. They are more suitable for server monitoring in my opinion. Check them out if you want to.

Now that you know about some amazing top alternatives – what would you pick to monitor your system?
Do you use some other tools for system monitoring in Linux? Which one is it? Do share your it with us in the comments.
If this helped you, consider supporting It's FOSS
It's FOSS has been helping people use Linux for the past 14 years. Help us stay independent from big tech. Become a Plus member, enjoy ad-free reading and get 5 eBooks.