

Windows has its famous task manager. Linux has several GUI and command line system monitors. Every Linux system comes with a couple of them.
On the command line, the top command is perhaps the goto command for checking the system resource utilization quickly.
Using top command apart from viewing the processes could be tricky. And this is where htop tops top. Pun aside, htop is a top-like utility but with a better and user-friendly interface.
In this guide, I will be showing you how you can install and use htop in Linux.
Install htop utility in Linux
You won’t find htop pre-installed on the majority of Linux distributions but being one of the most popular utilities, you will find htop in default repositories of almost every Linux distro.
So if your machine is powered by something that is based on Debian/Ubuntu, the following command should get your job done:
sudo apt install htopSimilarly, if you’re on Fedora, you can use the given command:
sudo dnf install htopAnd there’s also a snap package available if you like to avoid building packages from the source:
sudo snap install htopIf you’re on something else or want to build from a source, you can always refer to htop’s GitHub page for detailed instructions.
Once you’re done with the installation, you just have to use the htop command in the terminal, and it will reflect all the ongoing processes in your system:
htop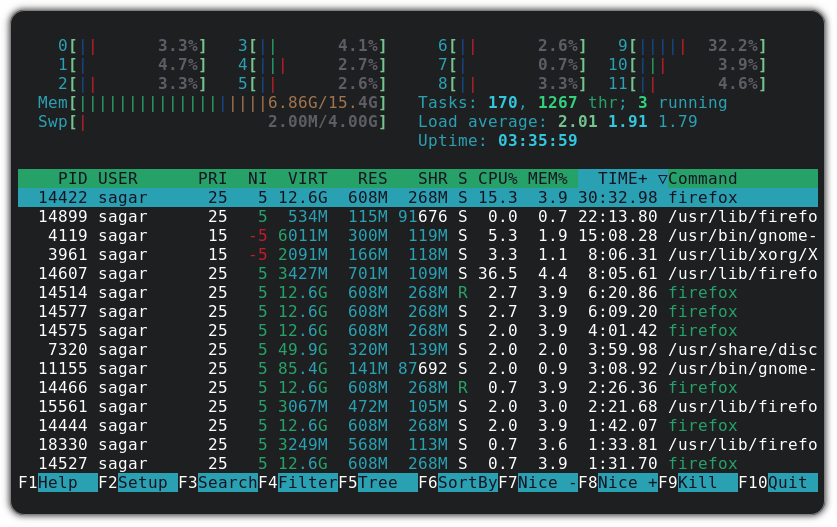
In htop, there is a color coding for the individual section, so let’s have a look at what each color indicates while using htop.
What different colors and statistics indicate in htop
So let’s start with the CPU usage bar, as it utilizes the maximum number of colors.
CPU usage bar

- Green: Resources consumed by user processes.
- Blue: Indicates low-priority threads.
- Red: CPU resources used by system (kernel) processes.
- Aqua blue: Indicates virtualized processes.
Memory bar

- Green: Memory being utilized by system processes.
- Blue: Memory used by buffer pages.
- Orange: Memory allocated for cache pages.
Statistics

- Tasks: 166 shows there is a total of 166 ongoing processes.
- 1249 thr indicates that those 166 processes are handled by 1249 threads.
- 1 running indicates that from those 166 processes, only one task is in a state of running.
- The load average indicates the average system load over a period of time. Since my system is Hexa-Core, anything under 6.0 is ok. This number may exceed, such as 6.1, so the upcoming processes have to wait for ongoing tasks to be completed.
- 1.86 is the average load for the last minute.
- 1.75 is the average load for the last 4 minutes.
- 1.47 is the average load for the last 15 minutes.
- Uptime tells how long the system has been running since last reboot.
Now, let’s jump to the actual implementation part.
How to use htop in Linux
As the htop is mainly used to check for system resources, let’s have a look at how you can sort the processes based on resource consumption.
Sort processes based on Resource Consumption
The easiest way to sort processes based on CPU and memory usage is to use your mouse pointer. Hover the cursor over the CPU or Memory section and click on any of those.
And there you will see an icon of a triangle △ and based on that you can sort the process based on highest to lowest resource consumption:
But if you are dealing with remote servers, you might not have the privilege to use a mouse and in those cases, you can use keyboard shortcuts.
Press F6 and it will bring up every option available to sort the ongoing processes:
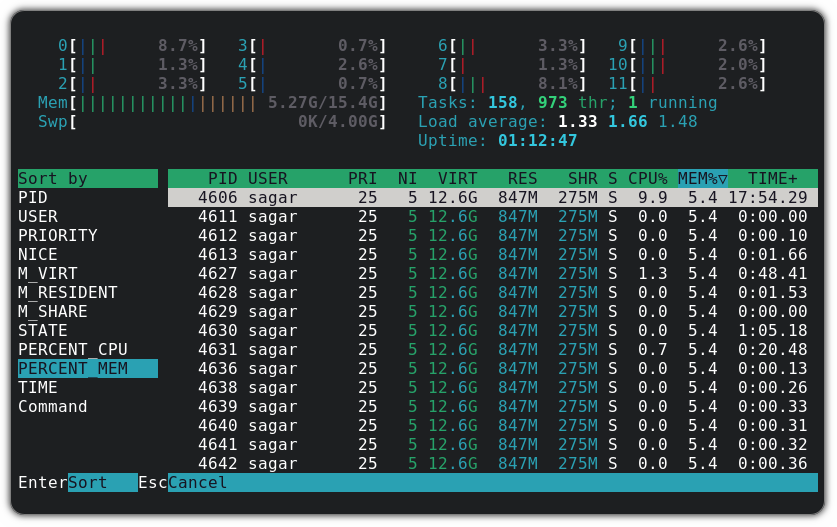
You can use arrow keys to select a preferred sorting option and then press the Enter key, results should reflect as intended.
Search for a specific process
If you want to look for a specific process and its resource consumption, you can press F3 and it will get you a search prompt as shown below:
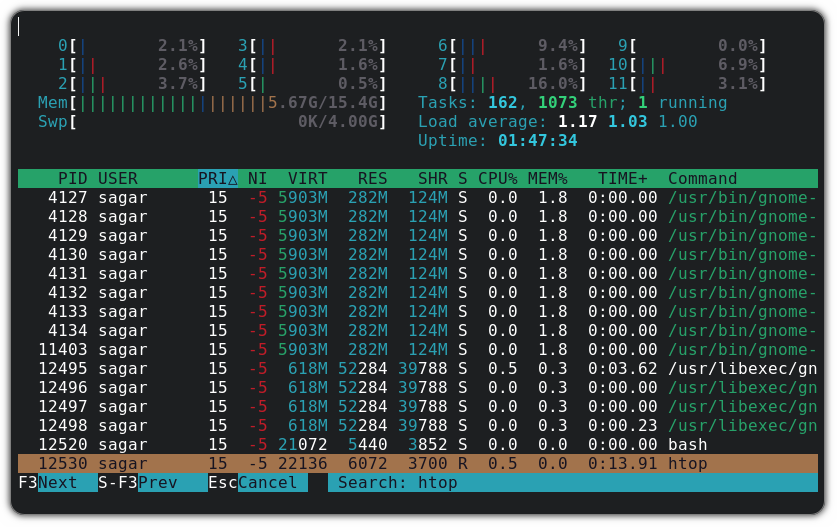
For example, I searched for htop, and it highlighted the process with light orange color. And you can press F3 for the next result.
Filter ongoing processes
While searching may get you the intended results, I find the filtering process using keywords even more effective as it presents a list of processes.
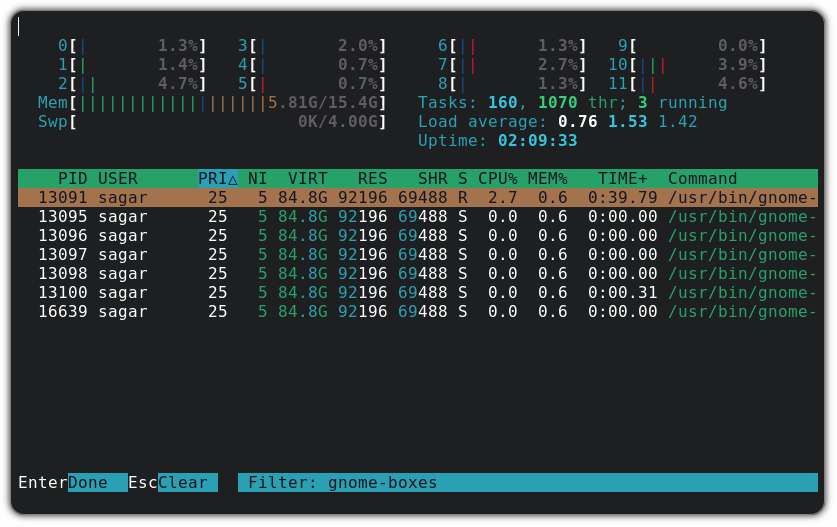
To filter processes, you have to press F4 and type the name of the process. For example, I filtered processes related to gnome-boxes:
Kill process
Once you made it to find the most resource-hungry and unnecessary process, you just have to press F9, and it will present you with termination signals:
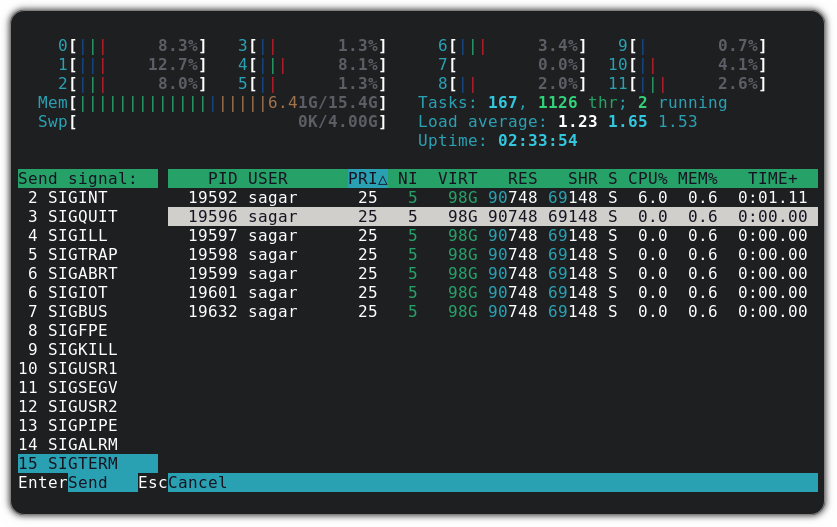
I can’t cover all 15 termination signals, we have a separate guide on different termination signals, so you can refer to that guide if you intend to learn more about them.
But I will recommend you use SIGTERM first, as it is the most efficient and friendly way to kill the process.
Customize htop
Here, my aim is to add a date and time and change the color scheme to monochrome.
First, press F2, and it will being setup prompt allowing users to change how htop looks:
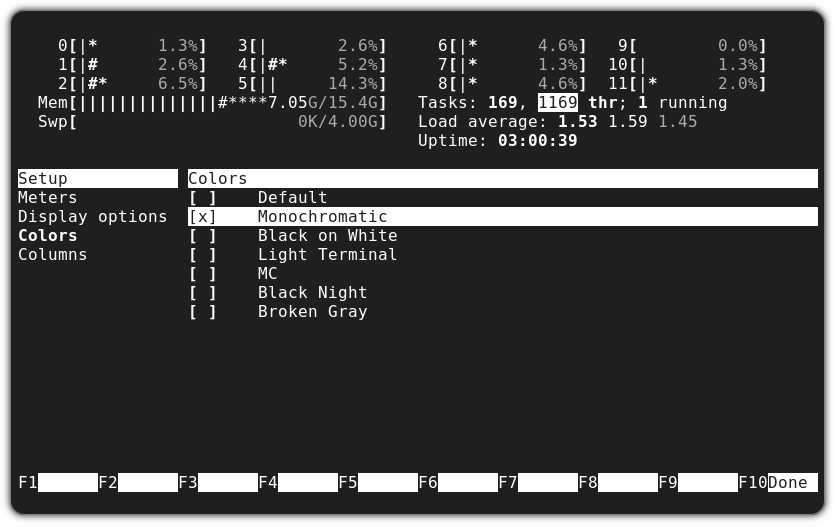
First, hover to the Colors sections and press Enter and it will allow us to change the color scheme. From there, select the Monochrome option and press Enter to save changes:
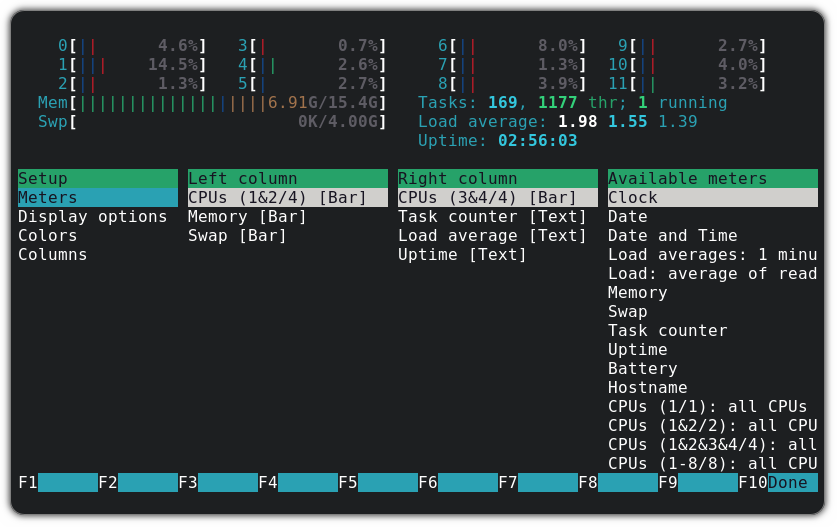
Now, go back to the setup option, and from there, use the left arrow key to explore available meters:
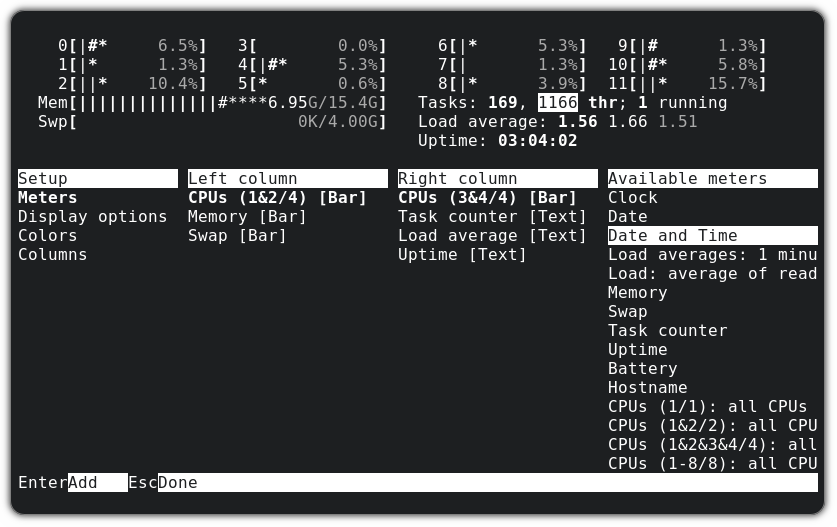
As I intend to add the Date and time, I have to press Enter once I find the option for it.
Here, it will allow you to place the date and time in any of the left and right columns and you can use the up and down arrow keys to change the order of columns.
So I placed the date and time meter with the last styling option (you can change styles using the spacebar):
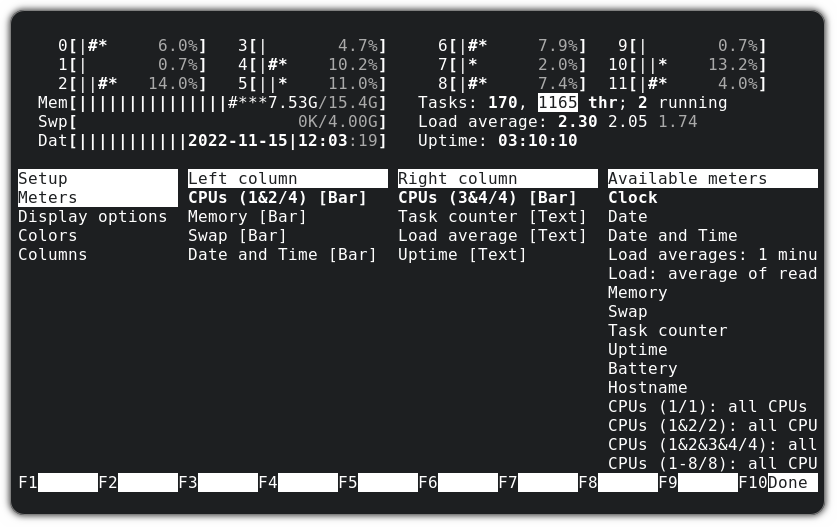
Once you are done aligning the date and time meter, press the enter key to save changes and F10 to close the setup prompt.
More than htop?
htop is good. But there are other similar tools that might be better than it. Check them out if you want to.
 Ankush Das
In this guide, I explained how you can install the htop utility in different Linux distributions and how you can use some basic functionalities of htop to manage system resources efficiently.
But htop can do a lot more and for that and to learn more, you can always refer to its man page, and we have a detailed guide on how you can get the most out of the man page in Linux.
If this helped you, consider supporting It's FOSS
It's FOSS has been helping people use Linux for the past 14 years. Help us stay independent from big tech. Become a Plus member, enjoy ad-free reading and get 5 eBooks.