
The Pareto Principle, also known as the 80/20 Rule, The Law of the Vital Few and The Principle of Factor Sparsity, illustrates that 80% of effects arise from 20% of the causes – or in layman’s terms – 20% of your actions/activities will account for 80% of your results/outcomes.
Although the original observation is related to economics, it can be widely adopted and used across all aspects of business, economics, mathematics, and processes. In computer science, the Pareto principle can be used in software optimization.
Let me show you how to create a Pareto diagram in LibreOffice spreadsheet tool, i.e. Calc.
Creating Pareto diagram in LibreOffice Calc
To be able to create a Pareto diagram, you need these three basic elements:
- The factors, ranked by the magnitude of their contribution
- The factors expressed numerically
- The cumulative-percent-of-total effect of the ranked factors
First, enter the data in a spreadsheet. Now let’s get started!
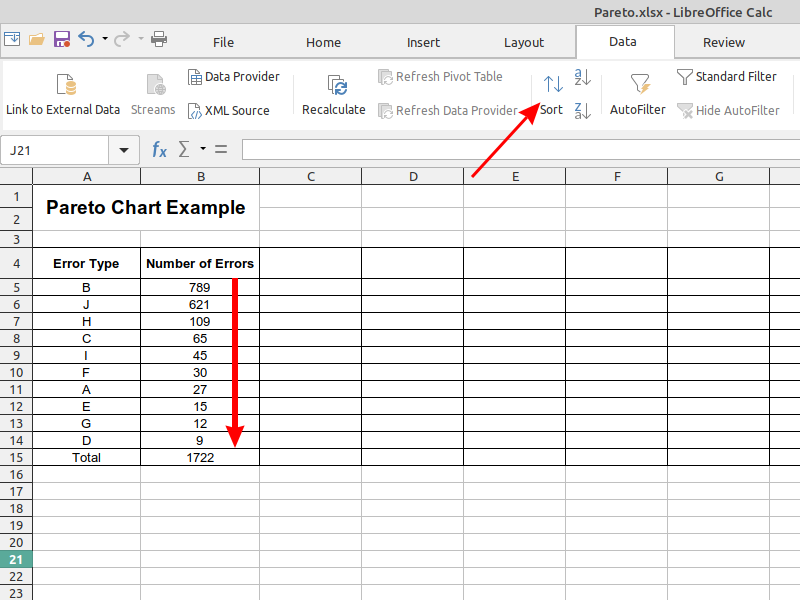
Step 1: Sort the data
Mark all rows from first to the last and at the Data tab click on the Sort option. At the Sort Criteria tab choose Sort key 1 and change the entry to Number of Errors or whichever name you choose. Make sure to tick Descending and finally OK.
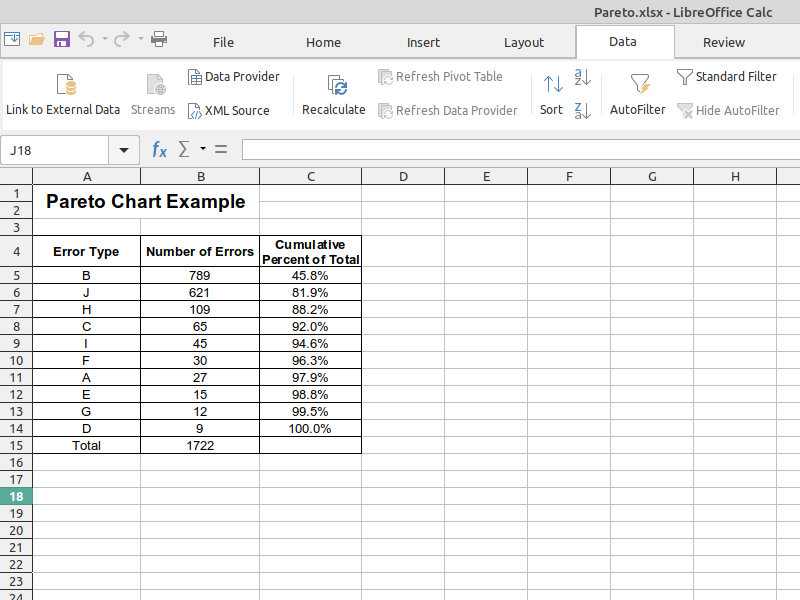
Step 2: Create the Cumulative Percentage values
To calculate the cumulative percent of a total, you will need one formula for the first cell (C5) and a different formula for cells C6 and below.
Generic formula for the first cell
=amount/totalIn the example shown, the formula in C5 is: =B5/$B$15
Generic formula for the remaining cells:
=(amount/total)+previous cell resultIn the example shown, the formula in C6 is: =(B6/$B$15)+C5
By dragging the fill handle down, you will get the correct formulas for the remaining cells.
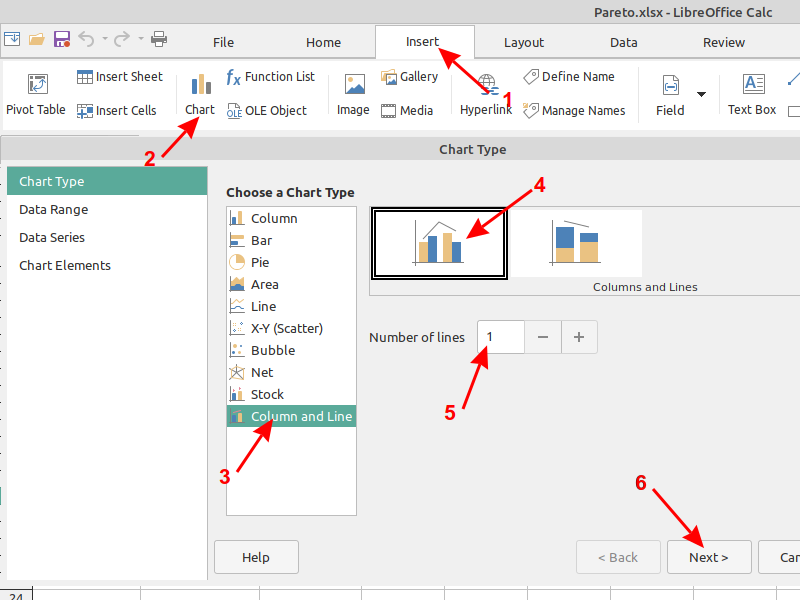
Step 3: Create the Pareto diagram
To create the chart go to Insert tab and then click on the Chart option.
In the upcoming Chart Wizard choose the chart type Column and Line with Number of lines set to 1 and click Next.
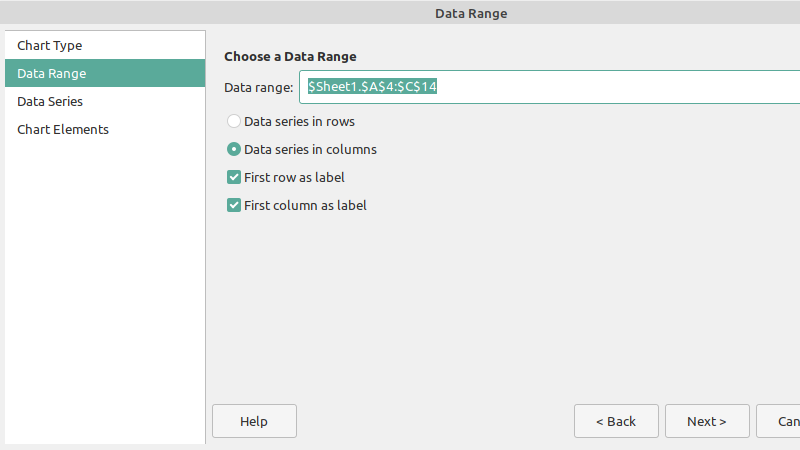
Select the correct data range $A$4:$C$14 by either using your mouse in the data range selector or by entering it manually. Leave the settings Data series in columns, First row as label, First column as label and click Next.
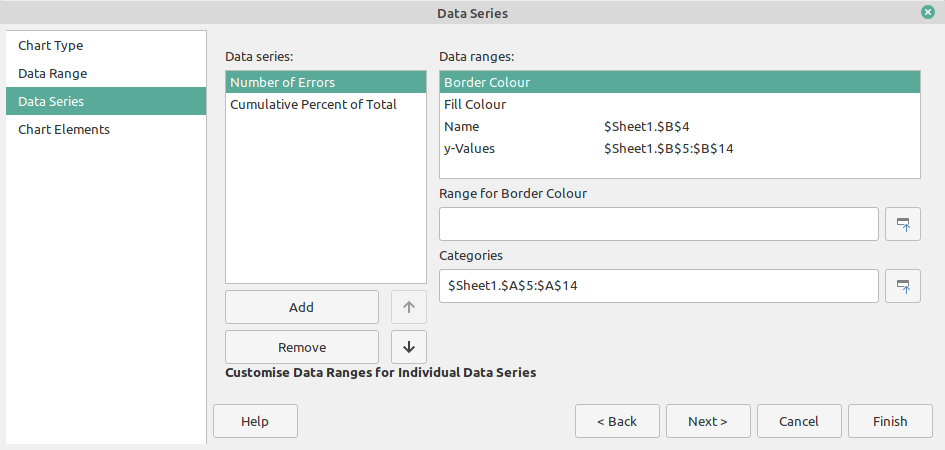
The following Data Series window should have everything filled in correctly, click Next.
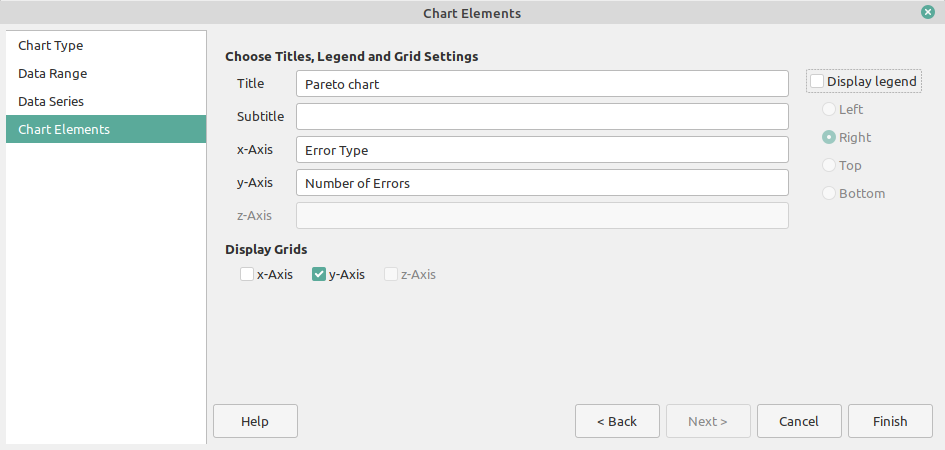
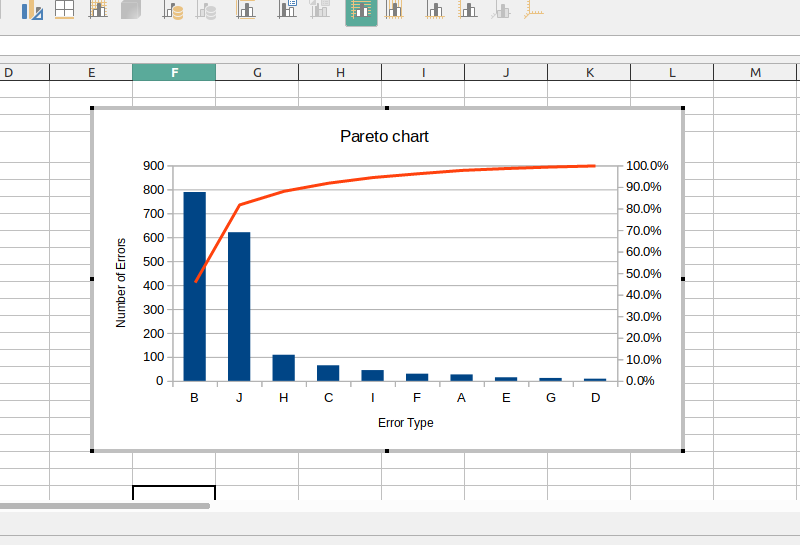
In the last window enter titles and remove the legend:
- Title: Pareto chart
- X axis: Error Type
- Y axis: Number of Errors
- Untick Display legend
- click Finish.
And this is the result:
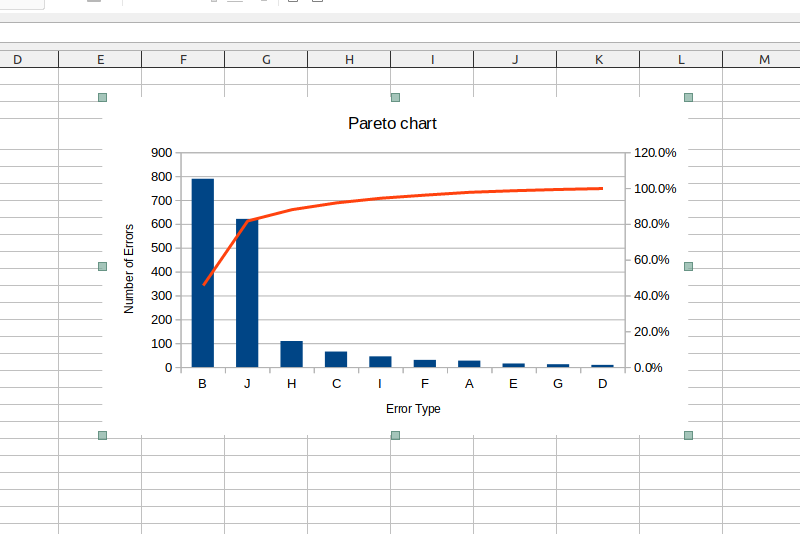
If the red line appears without any value, select it, then right click > Format Data Series > Align Data Series to Secondary y-Axis > Click OK.
Step 4: Fine tune the chart
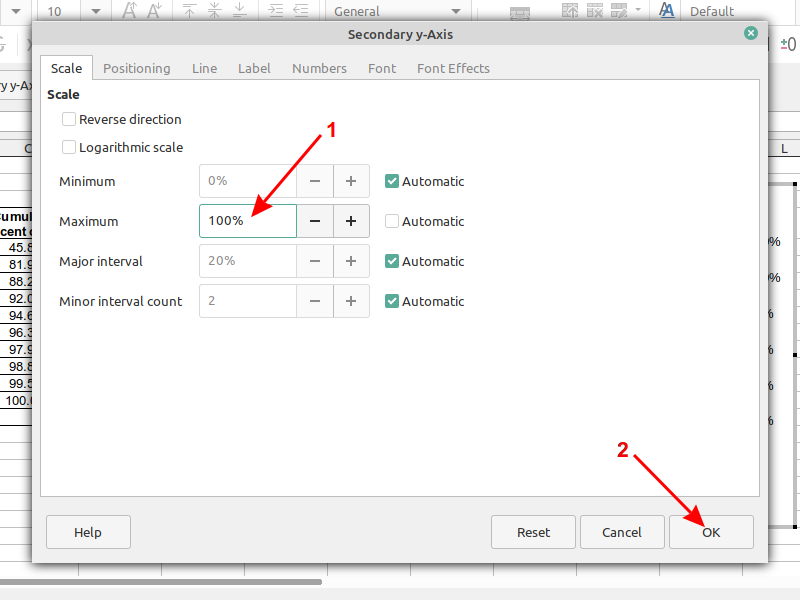
The range of the secondary y-axis is set to 0 – 120 , it needs to be up to 100.
Double click on the secondary y-axis . In the Scale tab, untick Automatic and enter 100 as the maximum value. Then click ok.
All done!
Conclusion
Using a Pareto chart to analyze problems in a business project allows focusing efforts towards the ones offering the most considerable improvement potential.
This is one of the many real-life scenario where I have used LibreOffice instead of other proprietary office software. I hope to share more LibreOffice tutorials on It’s FOSS. Meanwhile, you can learn these rather hidden LibreOffice tips.
 Abhishek Prakash
Which LibreOffice functionality do you use the most? Let us know at the comments below!