We live in a world where almost everything we have generates data. Data, which can be analyzed and visualized thanks to tools that create graphs showing the relation between variables.
These tools are famously called “plotting apps”. They can be used for basic maths task in school to professional scientific projects. They can also be used for adding stats and data to presentations.
There are plenty of free and open source plotting apps available for Linux. But in this article, I am listing some of the best plotting apps I have come across.
Best open source plotting apps
I am deliberately skipping productivity suits like LibreOffice. They could allow you to add graphs and plots in the documents and slides but they are very basic in terms of functionality.
Please also note that this is not a ranking list. The item at number one should not be considered better than the one at number five.
1. Matplotlib

Matplotlib is an open-source drawing library that supports many sketch types like plots, histograms, bar charts, and other types of diagrams. It’s mainly written in python; so if you have some knowledge of this programming language, Matplotlib can be your best option to start sketching your data.
The advantages are focused on simplicity, friendly UI, and high-quality images, besides the various formats such as PNG, PDF etc. for plots.
2. GnuPlot
GnuPlot is a command-driven plotting program that accepts commands in the form of special words or letters for performing tasks. It can be employed to manipulate functions and data points in both two- and three-dimensional in many different styles and many different output formats.
A special characteristic is that Gnuplot can also be used as a scripting language to automate the generation of plots.
You can refer to our documentation if you want to explore more about it before getting started.
3. Octave
GNU Octave is more than just a plotting tool. It helps in solving linear and nonlinear problems numerically, and for performing other numerical experiments using a language that is mostly compatible with MATLAB. It may also be used as a batch-oriented language.
Some of its features are
- A large set of built-in functionalities to solve many different problems.
- A complete programming language that enables you to extend GNU Octave.
- Plotting facilities.
So, if you are interested in Octave, don’t be afraid and go to check its documentation.
4. Grace

Grace is a tool to make two-dimensional plots of numerical data. Its capabilities are roughly similar to GUI-based programs like Octave plus script-based tools like Gnuplot or Genplot. In other words, it is a mix of a good user interface with the power of a scripting language.
It’s important to mention that these two last characteristics let you do sophisticated calculations or perform automated tasks, which helps a lot when you’re analyzing any type of data.
Other important aspect to mention is that it also brings tools like curve fitting, analysis capability, programmability, among others. So, if you want to know more about these helpful tools, go to its official website and check its other features.
5. LabPlot
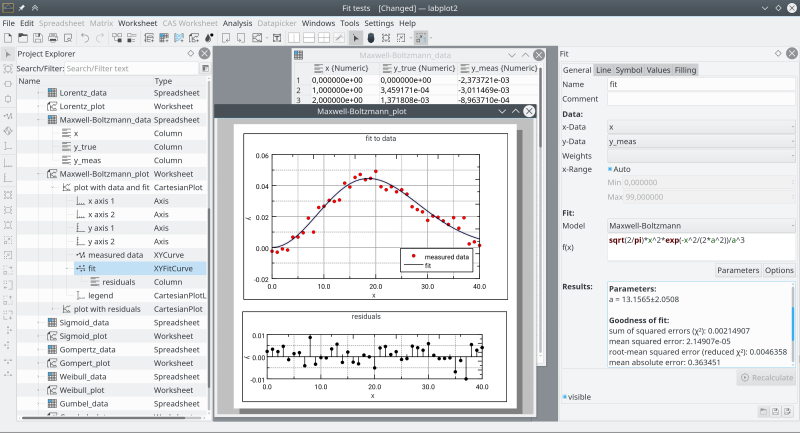
LabPlot is a program for two- and three-dimensional graphical presentation of data sets and functions. It comes with a complete user interface, which provides you with a lot of functions like Hilbert transform, statistics, color maps and conditional formatting, and its most recent feature, Multi-Axes.
LabPlot allows you to work with multiple plots which each can have multiple graphs. The graphs can be produced from data or from functions; depending on what you need.
For more information, remember that the documentation and its community can be your best friend.
6. ROOT
ROOT is a framework for data processing, which is created by the famous CERN lab which is at the heart of the research on high-energy physics. It is used to write petabytes of data recorded by the Large Hadron Collider experiments every year.
This project is used every day by thousands of physicists who analyze their data or perform simulations, especially in high-energy areas.
It is written in the C++ programming language for rapid and efficient prototyping and a persistence mechanism for C++ objects. If you don’t like C++, I have good news for you. It can be used with Python as well.
This project is incredibly a complete toolkit, it can help you from creating a simple histogram to providing interactive graphics in web browsers. Awesome, isn’t it?
7. Plots
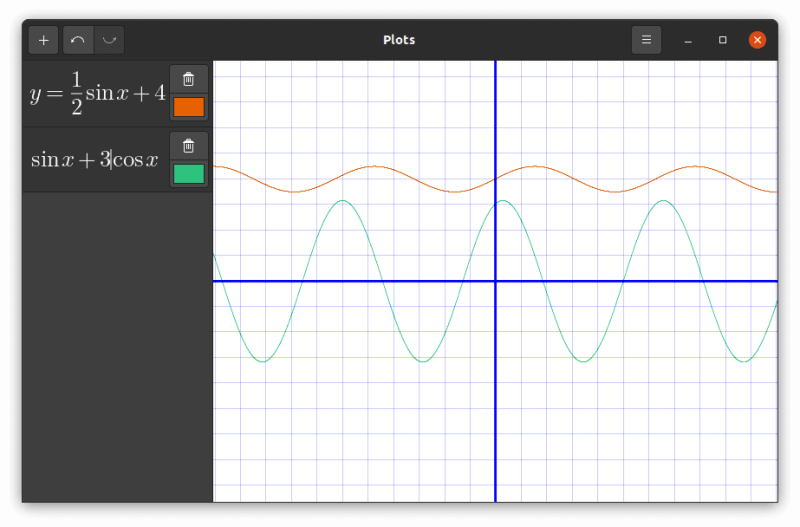
This last option is more dedicated to basic academic students who are begin introduced to the graphs and math functions.
This open-source software called Plots is a basic but powerful tool if you need to quickly visualize any data or math function in the least time possible. This is because it has not a lot of extra function, but notice that it doesn’t mean it has no power at the time of plotting.
So, if you’re starting in this area of data visualization, surely this last option is the best for you, Also, I’d suggest you check our article about Plots to know how to set it up and get started.
Conclusion
In my opinion, these open-source projects do more or less the same tasks; of course, some of them have more or fewer characteristics. The key is the way it generates the plotting; because one works with C as its programming language, while another works with Python. I suggest you to get informed about each of these plotting tools and choose the best that fits your tasks and necessities.
Have you ever used one of the tools on this list? What is your favorite open-source tool for plotting? Please let us know in the comments below.
If you found this article interesting, please take a minute to share it on social media; you can make a difference!