
Stress testing is the best way to identify your system's true potential. But it's not always about how much GHz you can push.
The key to knowing the true potential is to test your system under sustained loads as getting the work done under pressure is something we all ask for.
While multiple GUI options exist to monitor the stress, you don't have many user-friendly options for the terminals.
s-tui is one of the rare such tools; the best part is it works well with the mouse too!!
Stress Terminal UI for CPU monitoring in Linux
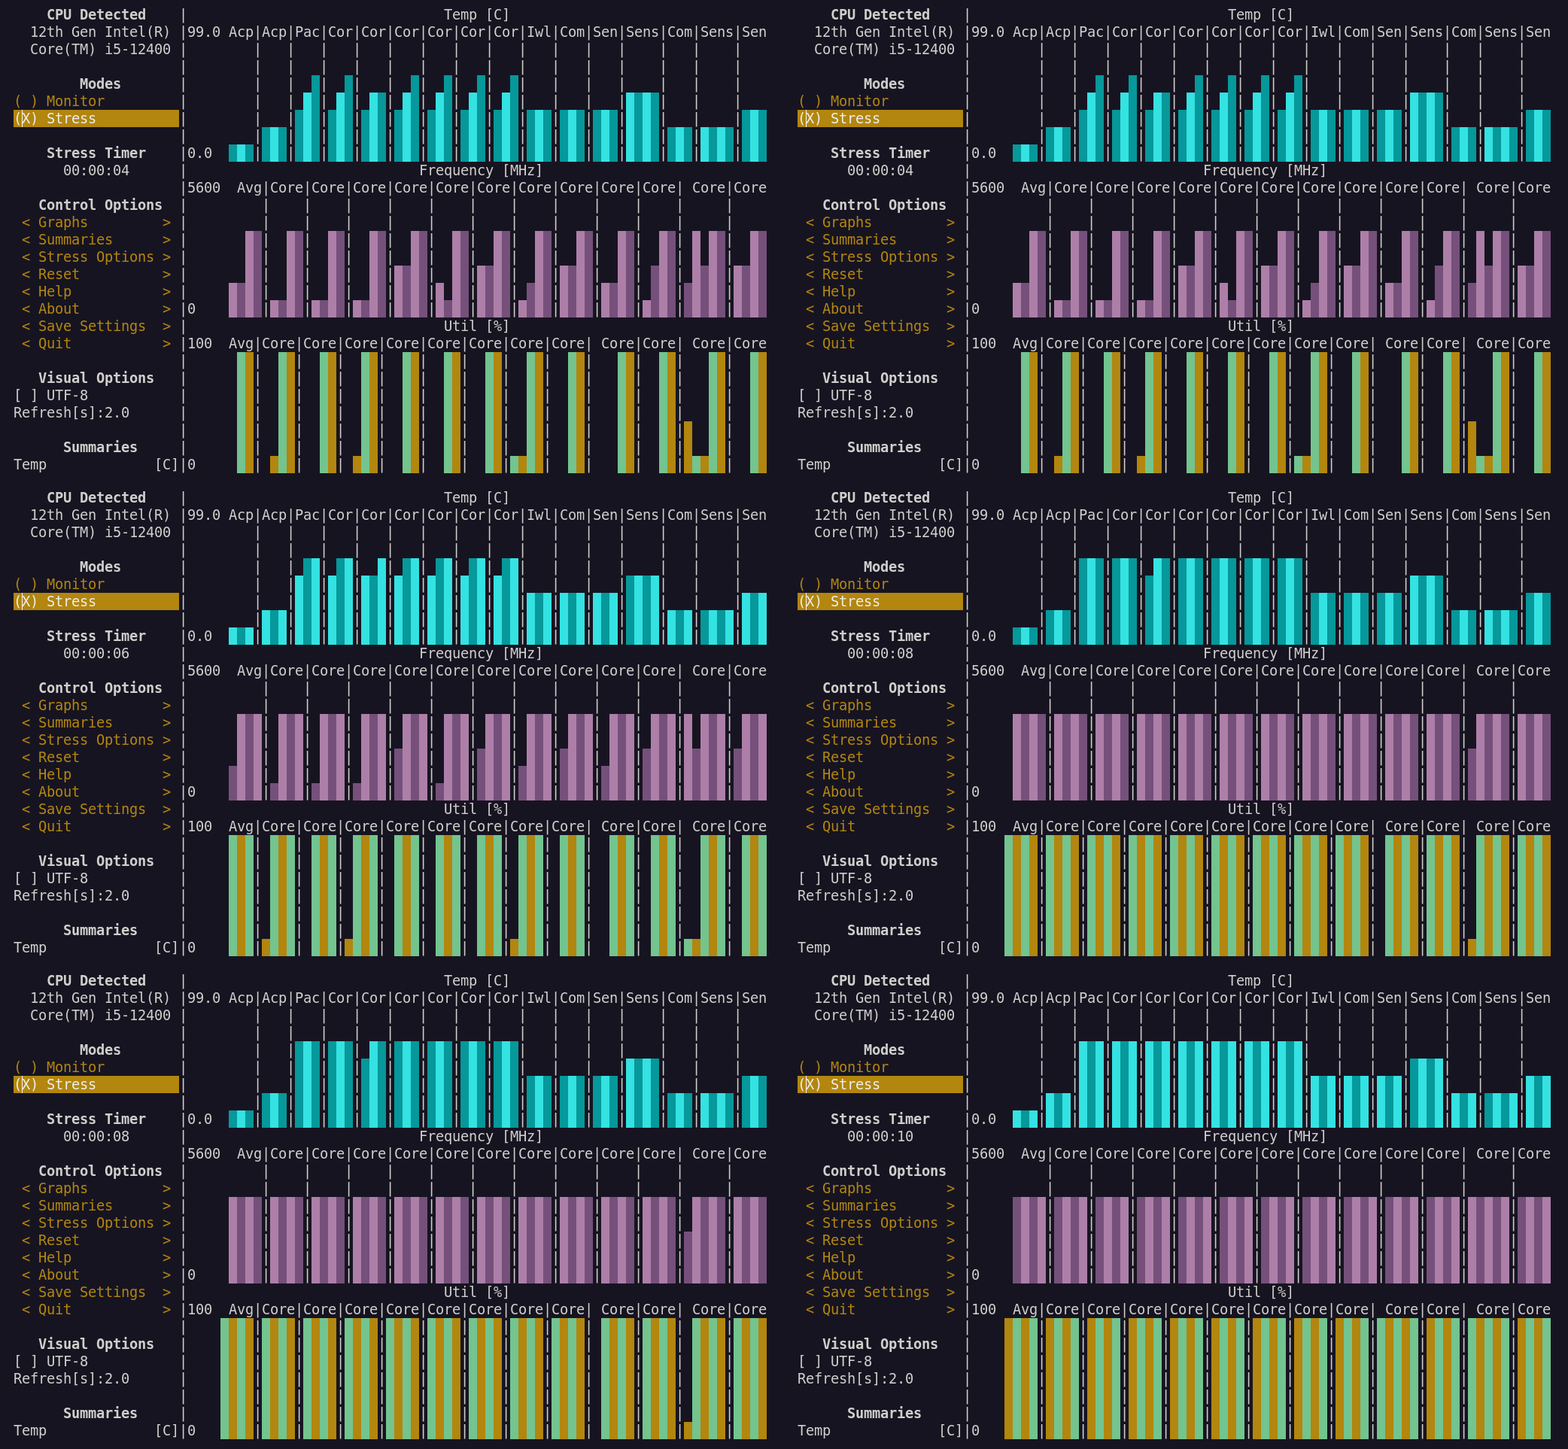
Stress Terminal UI (s-tui for short) is a CPU monitoring tool that runs entirely within your terminal. It is written in Python and is developed by Alex Manuskin.
Let's have a look at what it has to offer:
Features
Stress Terminal UI offers the following features:
- Visualize CPU Frequency, Utilization, Temperature, and Power Usage
- Displays performance dips caused by thermal throttling
- Lightweight and uses minimal resources
- Requires no display servers
- Stress Operation mode for stress testing the CPU
Installation
stress in your system.There are two ways to install s-tui: Using pip or using the package manager of your system.
Using pip will get you a slightly newer version but requires you to install pip on Ubuntu.
And if you want to use it with pip, here's the command for the installation of s-tui with pip:
pip install s-tuiUsing package managers
If you prefer using the system package manager like I do, here's how you do it.
For Ubuntu/Debian base:
sudo apt install s-tuiFor Arch base:
sudo pacman -S s-tuiFor Fedora/RHEL:
sudo dnf install s-tui stressOnce done, you can start the s-tui by simply executing:
s-tuiBasic usage of s-tui
If you have installed stress utility, there are two modes given to you:
- Monitor: This shows how the CPU is managing the resources for the ongoing tasks.
- Stress: It will stress-test your system.
Now, let's have a look at what customization options you get.
Customize what information to show
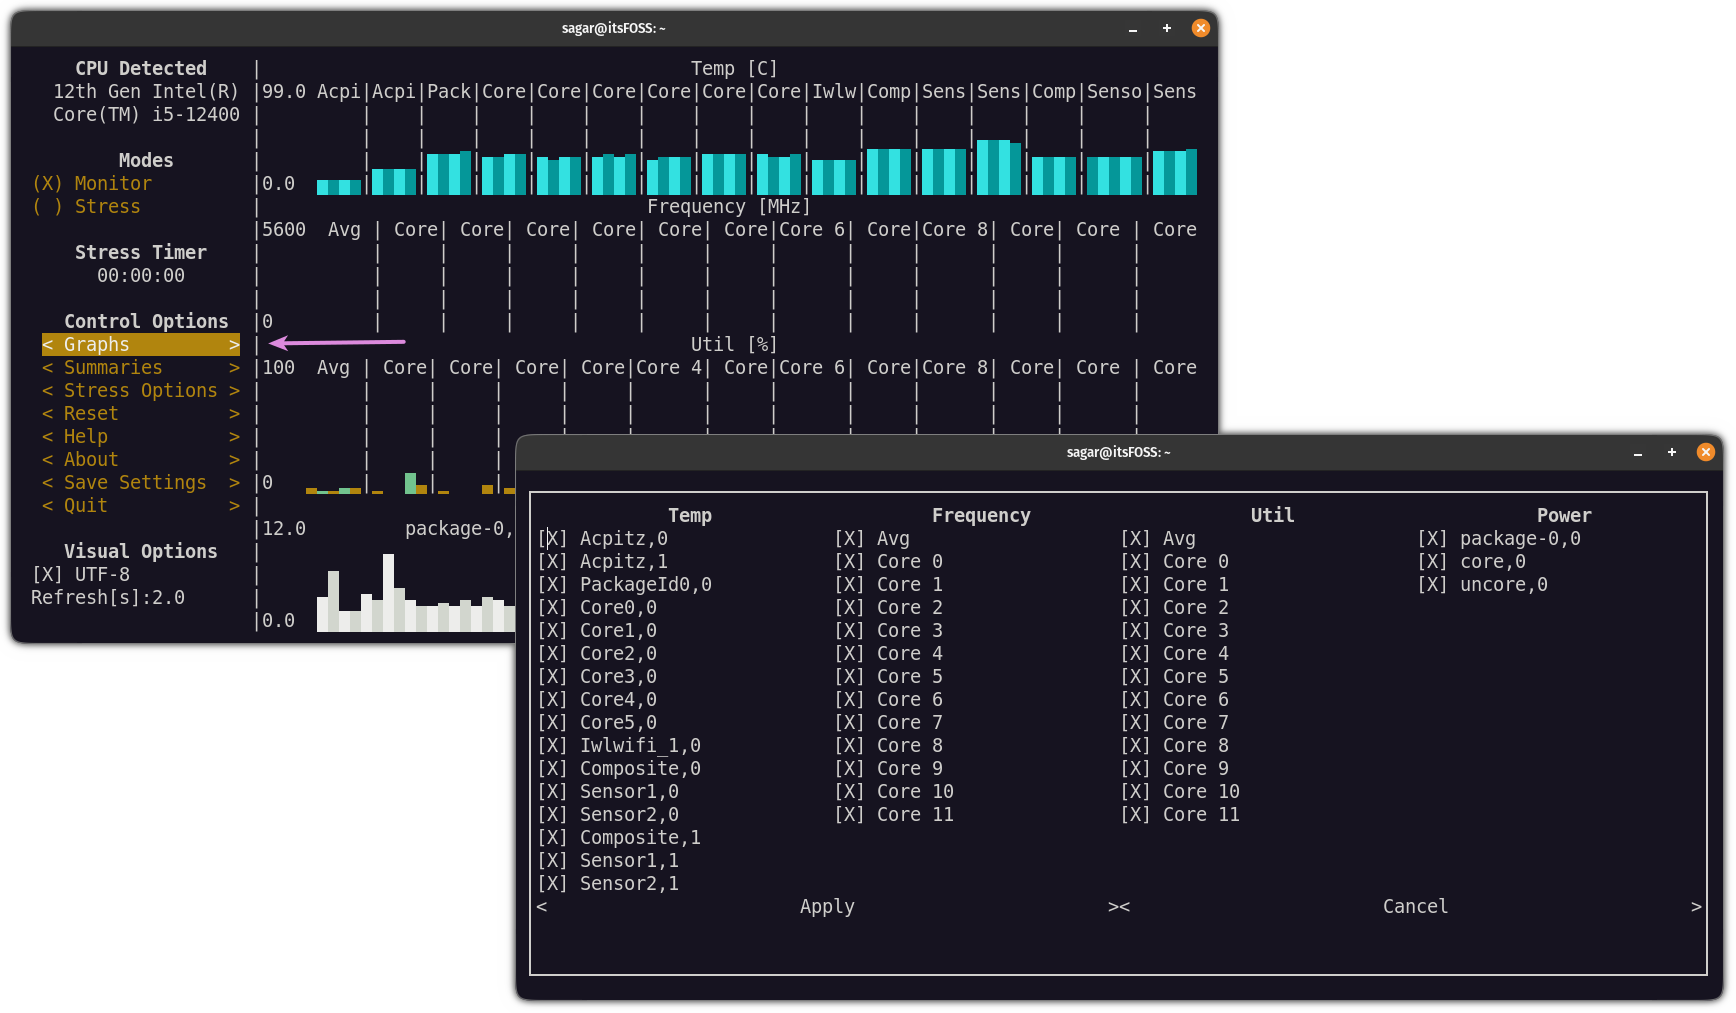
To change what is being shown on the screen, click on the Graphs under the Control options, and from here, you can remove elements that are not necessary for your case:
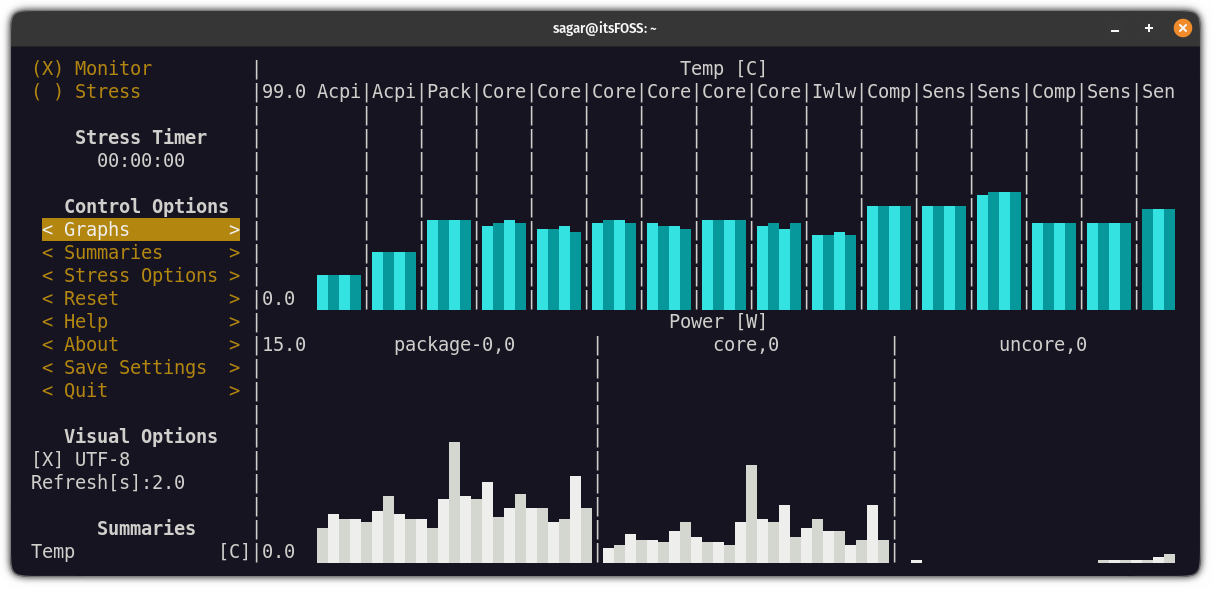
For example, here, I went with temperature and power monitoring only:
Customize the summary section
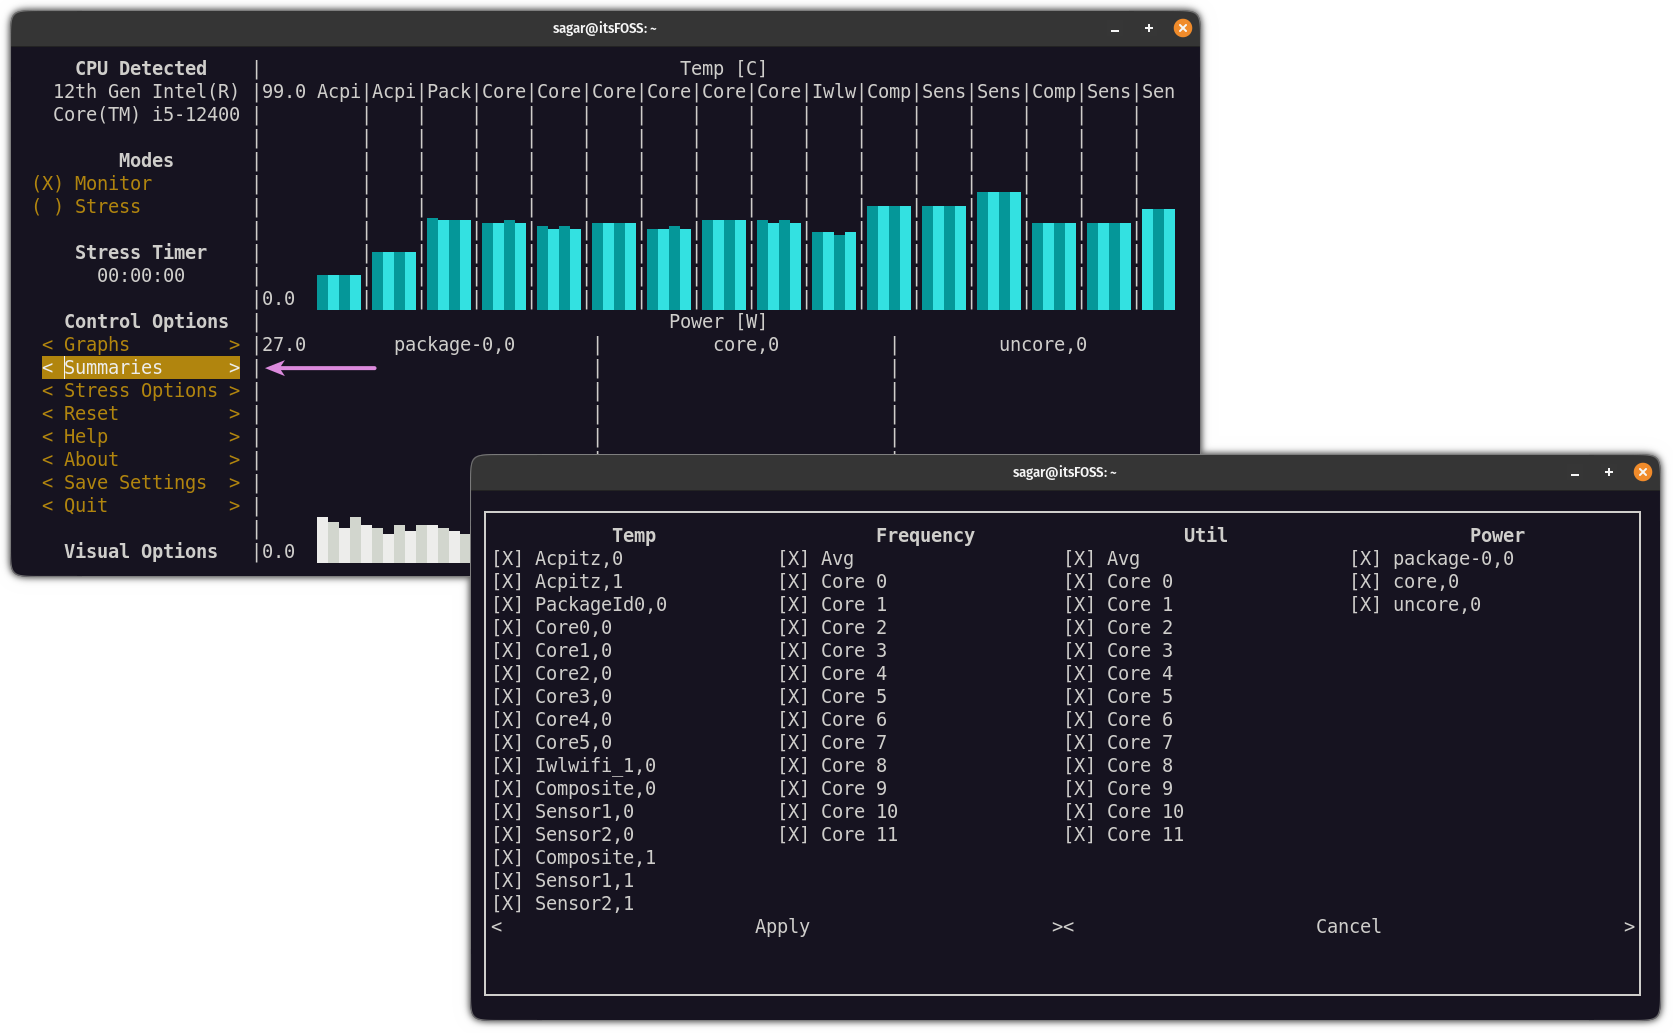
The summary section is located after the Visual options and will show the summary for every monitoring element in the text (if you prefer).
And to change what is being shown in the summary section, click on the Summaries and uncheck the unnecessary options:
Adding a timer for the stress test
You can also configure the time duration for the stress test in s-tui.
To do so, click on Stress Options and here, you will find Time out where you have to specify the stress test duration in seconds.
Once done, save the changes:
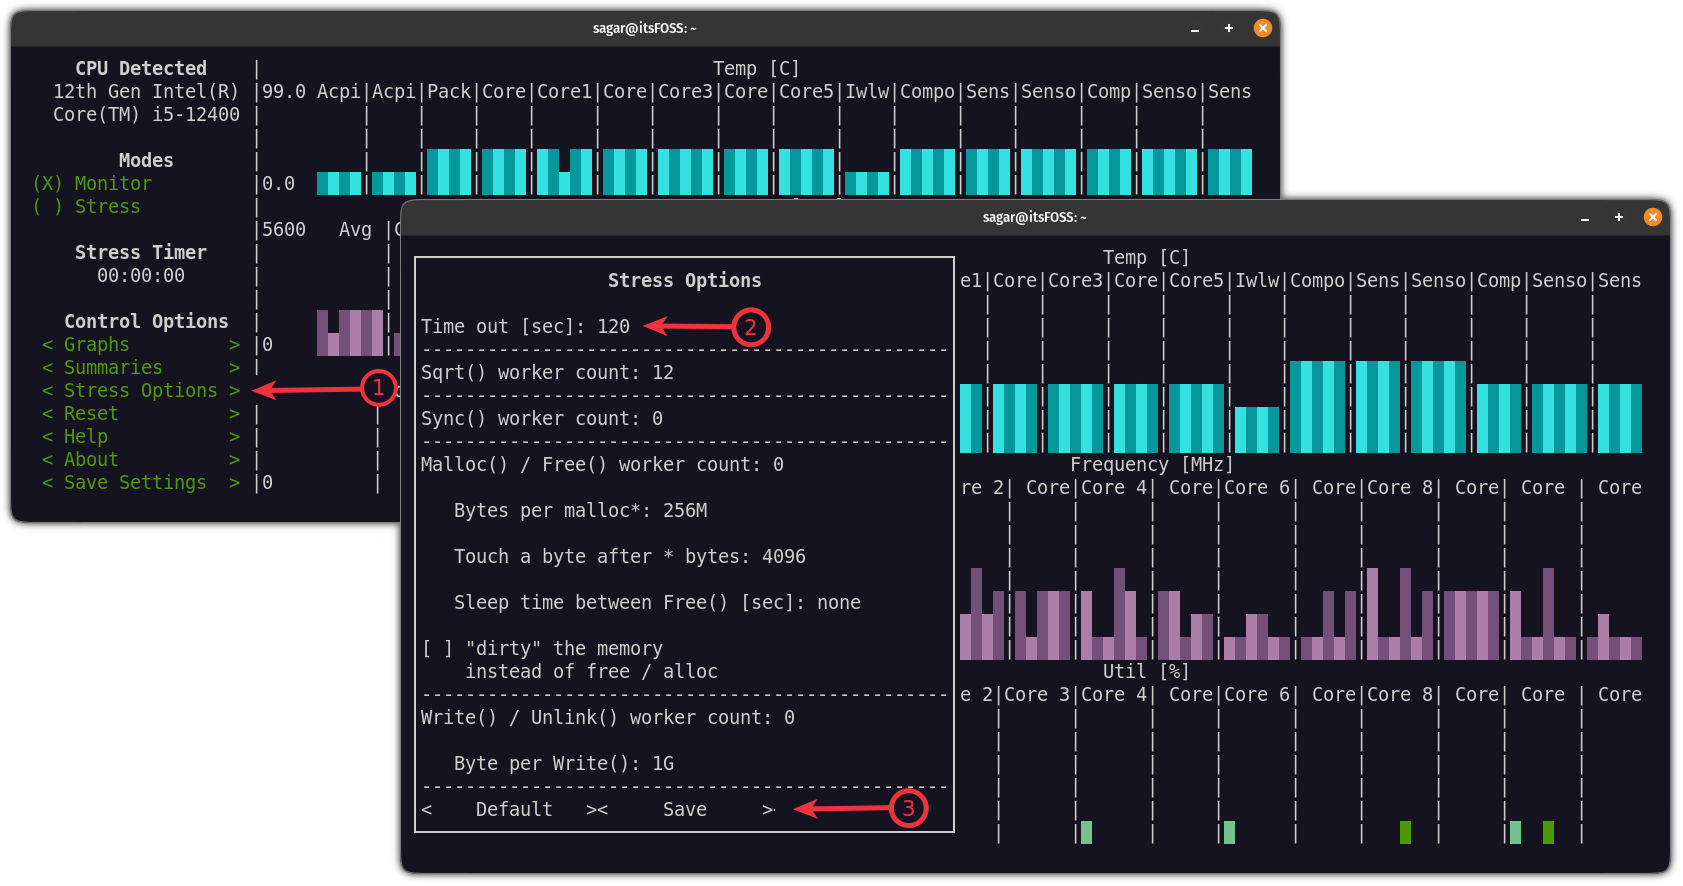
Pretty cool. Isn't it?
More CPU tools and tips for your Linux system
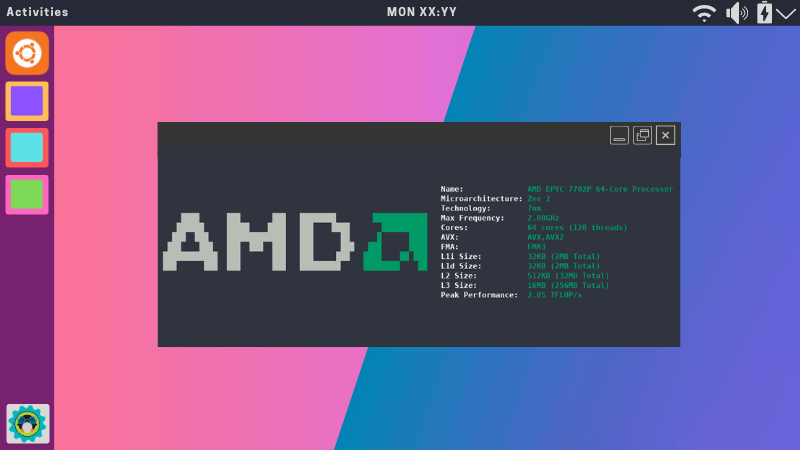
If you just want to display your CPU details, here's a beautiful way for that.
If you are coming from Windows and missing CPU-X, here's an alternative you could explore.

For hardcore terminal users, the command line always provides a way for everything imaginable.
If you are someone who prefers to have GUI over the terminal, we made a detailed guide on how you can stress test your CPU using GUI and terminal:
I hope you will find this guide helpful.
Reviews on web
What others are saying about STUI:
- Using Stress-Terminal UI (S-TUI) for Stress Test on Linux on windgate.com


