
If you’ve spent any time in the Linux community, you know that systemd is a hot topic. Some people love it because it handles everything; others wish it didn't! But here’s the reality: almost every major Linux distribution (like Ubuntu, Fedora, and Debian) uses it today.
Think of systemd as the "manager" of your computer. When something goes wrong, like your Wi-Fi won't connect or a creative app keeps crashing, systemd is the one with all the answers.
But where to find those answers? systemd has built-in tools that help you troubleshoot issues with your system. If you’re just starting your Linux journey, I recommend exploring the following four tools.
1. Systemctl
In Linux, background apps are called services. If your system is not accepting SSH connections, you use systemctl to see what’s happening under the hood.
I mean, before you try to fix something, you need to know if it's actually broken.
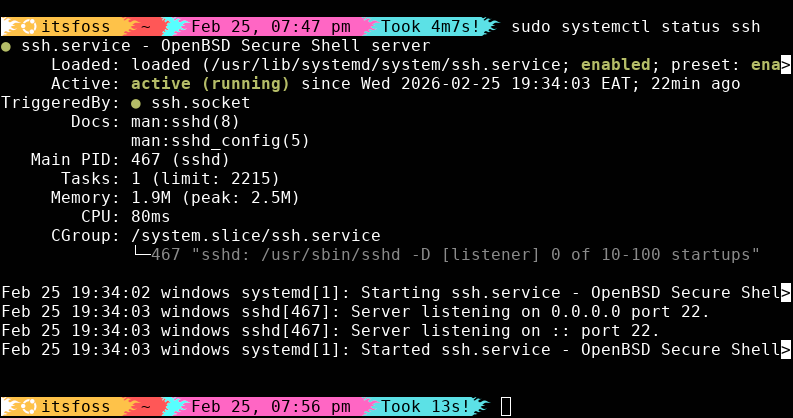
sudo systemctl status sshThis is the most important command in a Linux user’s toolkit. When you run it, pay attention to the Active line:
- Active (running): Everything is great!
- Inactive (dead): The service is off. Maybe it crashed, or maybe you never turned it on.
- Failed: This is the red flag. systemd will usually give you a "Main PID" (Process ID) and a reason for the failure right there in the terminal.
The "turn it off and on again" trick
We’ve all heard it: "Have you tried restarting it?" Restart a service in Linux with systemctl.
- Kickstart a failed one:
sudo systemctl start ssh - Stop a lagging service:
sudo systemctl stop ssh - Reset:
sudo systemctl restart ssh - Disable a service (to speed up boot):
sudo systemctl disable ssh
2. Journalctl
When an app crashes, it doesn't just vanish. It usually screams an error message into the void. Journalctl is the tool that catches those screams and saves them in a "journal" for you to read later.
Unlike old-school Linux logs (which were scattered across dozens of text files), systemd keeps everything in one central, encrypted location.
Filtering the noise
If you just type journalctl, you’ll see thousands of lines of code, most of it is boring stuff like "System time updated." To be a good detective, you need to filter:
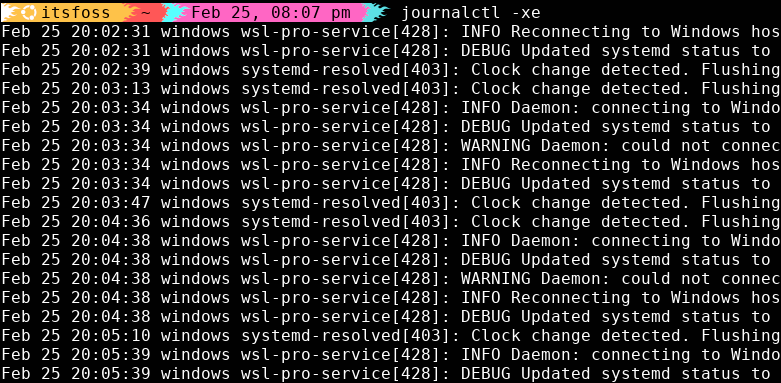
journalctl -xe
- -x: Adds "catalog" info (it explains the errors in plain English).
- -e: Jumps straight to the end of the log so you see the newest stuff first.
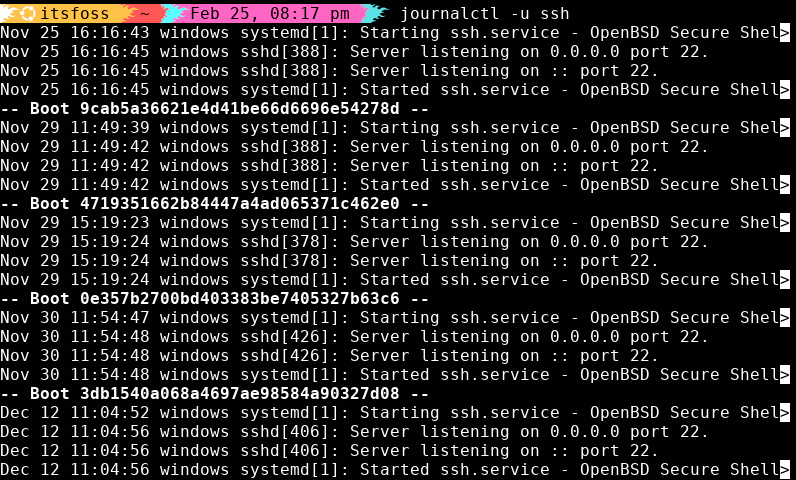
Targeting a Specific App: If you want to check the issue with a specific app, don't read everything, just read the entries for that specific app:
journalctl -u ssh
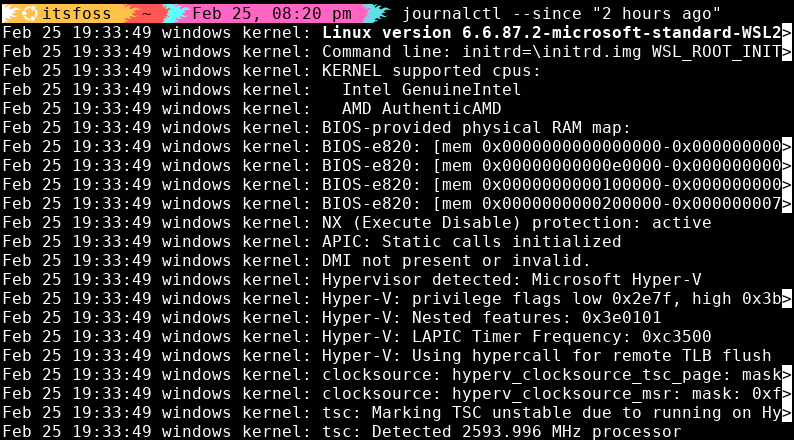
Time Travel: Did your computer freeze two hours ago? You can ask the journal to show you only that time frame:
journalctl --since "2 hours ago"
3. Systemd-analyze
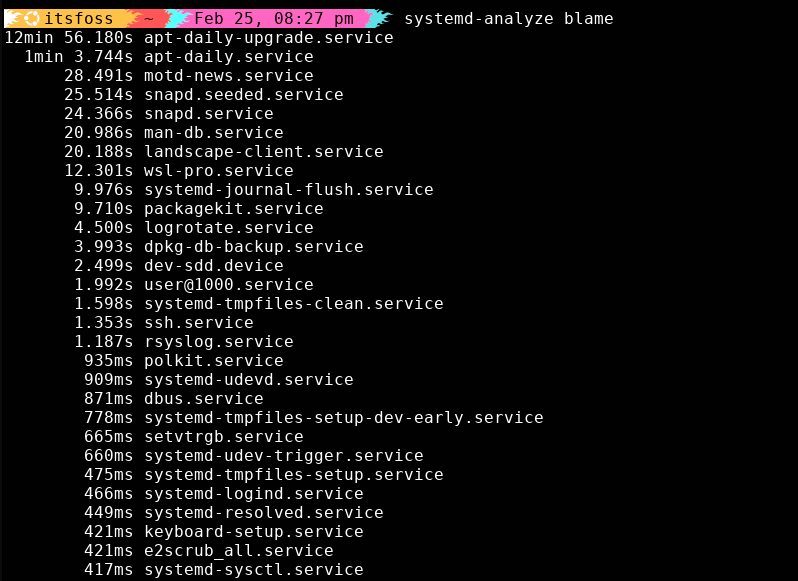
Is your computer taking forever to start up? Instead of guessing which app is slowing you down, you can ask systemd-analyze to blame the culprit. This tool measures every millisecond of your boot process and tells you exactly which service is holding things up.
Run this command to see a ranked list of the slowest-starting apps:
systemd-analyze blame
You might find that a "Modem Manager" you don't even use is taking 2 minutes to start. This gives you the power to disable it and save time every time you turn on your PC.
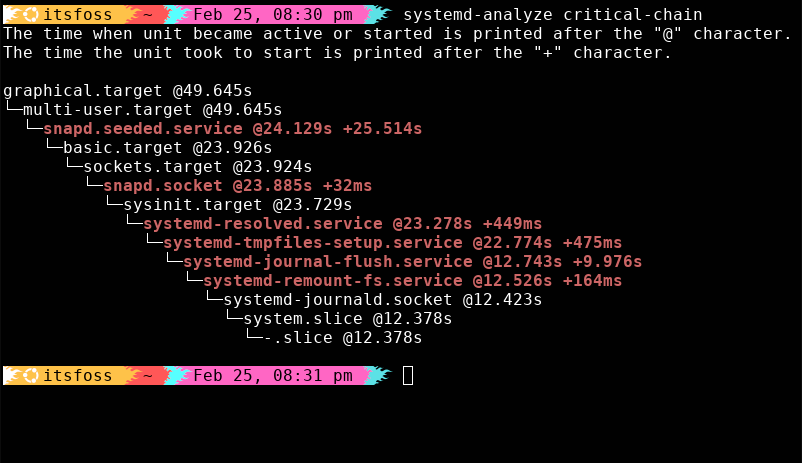
Additionally, some apps can't start until other apps are finished. If App A waits for App B, it creates a chain.
systemd-analyze critical-chain
This shows you the path systemd took to reach your desktop. If one link in the chain is slow, the whole system feels sluggish. You can learn more about optimizing Linux boot speed in our dedicated guide.
systemctl status, journalctl, and systemd-analyze are 100% safe. They are "read-only." However, be careful with sudo systemctl stop. If you stop a service like dbus or systemd-logind, your screen might freeze or you might get logged out!4. Coredumpctl
Sometimes, an app doesn't just have an error, it crashes completely. In programmer terms, it "dumped its core." This means the app threw its entire memory onto the floor and quit.
Coredumpctl is like a forensic investigator. It lets you look at that memory "snapshot" to see what the app was doing right before it died.
Listing the crashes
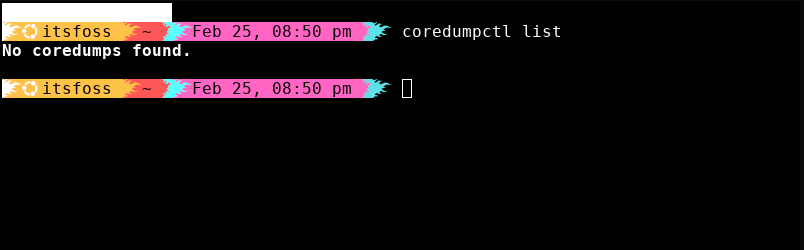
To see a table of every app that has crashed on your system recently, use:
coredumpctl list
The "Detective Report"
If you see that your favorite app crashed, you can get the full report by using its Process ID (PID) from the list:
coredumpctl info [PID]
This will show you things like the "Signal" (usually SIGSEGV, which means the app tried to touch memory it wasn't allowed to) and a "Stack Trace" (the last few functions the app ran).
coredumpctl installed by default. You can usually get it by running sudo apt install systemd-coredump.Conclusion
By using these systemd tools, you’ve moved past the "I'll just reboot and hope for the best" stage. You can now see the status of your apps, read their logs, speed up your boot time, and investigate crashes like a seasoned Linux user.
Next time something feels "off" on your Linux machine, don't panic. Just remember: systemctl for the status, journalctl for the logs, systemd-analyze for the speed, and coredumpctl for the crash.