
If you’ve been a Linux admin for any amount of time, you’ve probably lived this scene: your servers behave flawlessly all week… and then the moment you sit down with a coffee, the CPU spikes, a critical service slows to a crawl, and suddenly everyone’s pinging you asking why the service or app or website feels “laggy.”
You check top. Everything looks normal.
You restart a few services. Nothing changes.
You try strace. It helps, but not without slowing everything else down.
You consider diving into tcpdump and instantly regret it. Whoc could read al that?
This is where eBPF comes in. eBPF (Extended Berkeley Packet Filter) lets you attach tiny, sandboxed programs directly to the Linux kernel, no restarts, no recompiling, no intrusive overhead. In practice, you gain X-ray vision into your system’s behavior, in real time, with almost zero performance penalty.
And thanks to the amazing CLI tools built around eBPF, you can debug problems that were previously “impossible” to catch.
Before you see those eBPF tools, let me tell you that you need to take the kernel seriously. Here's why.
Know this before trying eBPF
Because eBPF hooks directly into the kernel, a few conditions need to be met for things to work smoothly. Otherwise, these new tools will either fail to load or behave unpredictably.
Kernel version matters
You must use Linux kernel version 4.1 or newer. Now, most modern distributions ship with a kernel version 4.1 and higher, but there could be some production servers still rocking the older kernel with enterprise support. It is rare but possible.
I generally go with this rule: newer the kernel, the better the eBPF support.
Kernel must be built with the right options
Even if the Linux kernel version is good enough, certain kernel flags need to be enabled. Most mainstream distros already include them, but it’s worth knowing what matters:
CONFIG_BPFCONFIG_BPF_SYSCALLCONFIG_BPF_JITorCONFIG_HAVE_EBPF_JITCONFIG_BPF_EVENTS(for kprobes and tracepoints)CONFIG_IKHEADERSor access to kernel headers
Without these, you'll see errors like “failed to load BPF program” or “unknown map type”. Some eBPF tools may also silently fail to trace anything.
If your environment uses custom-compiled kernels, double-check the config.
You likely need root (or near-root) privileges
Most tracing tools rely on the ability to load eBPF programs into the kernel. That typically requires root, or CAP_SYS_ADMIN, and sometimes CAP_BPF or CAP_PERFMON on newer systems.
🚧 Install all eBPF tools at once
While I'll discuss more than ten eBPF tools, you don't need to install them individually. You can get them with different meta packages.
I'll include the commands for Debian/Ubuntu. Use your distribution's package manager:
sudo apt install -y bpfcc-tools bpftrace
sudo apt install -y linux-tools-common linux-tools-$(uname -r)
This gives you:
- bpftrace: a high-level, DTrace-like language for on-demand kernel debugging
- BCC tools (bpfcc-tools): 50+ ready-made eBPF commands
- bpftool: for inspecting running eBPF programs (linux-tools-common)
Now let’s jump into the tools that actually save you when production is on fire.
1. bpftrace: The ultimate custom debugger
Ever wished you could ask the kernel, “What’s going on in that function right now?” That’s bpftrace.
It’s a tiny scripting language designed for one-off investigations. Perfect for those weird bugs that strike only once an hour.
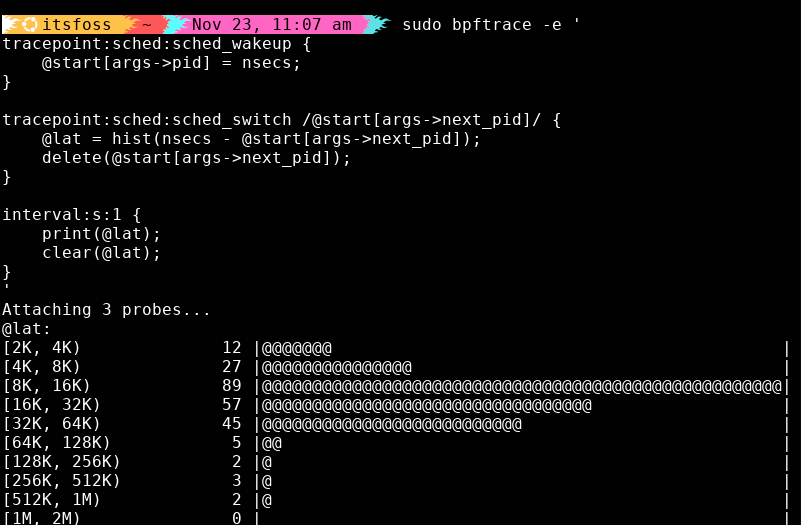
I once debugged a short-lived slowdown in a connection-pooling service. CPU was fine; disk was fine. But threads were waking slowly. With bpftrace, I traced the kernel scheduler itself and caught the exact moment those wakeups spiked.
Here’s the script I used to measure wakeup-to-schedule latency:
sudo bpftrace -e '
tracepoint:sched:sched_wakeup {
    @start[args->pid] = nsecs;
}

tracepoint:sched:sched_switch /@start[args->next_pid]/ {
    @lat = hist(nsecs - @start[args->next_pid]);
    delete(@start[args->next_pid]);
}

interval:s:1 {
    print(@lat);
    clear(@lat);
}
'
It prints a live histogram of scheduler latency, pure gold when you’re hunting mysterious performance drops.
2. execsnoop: Catching fleeting processes
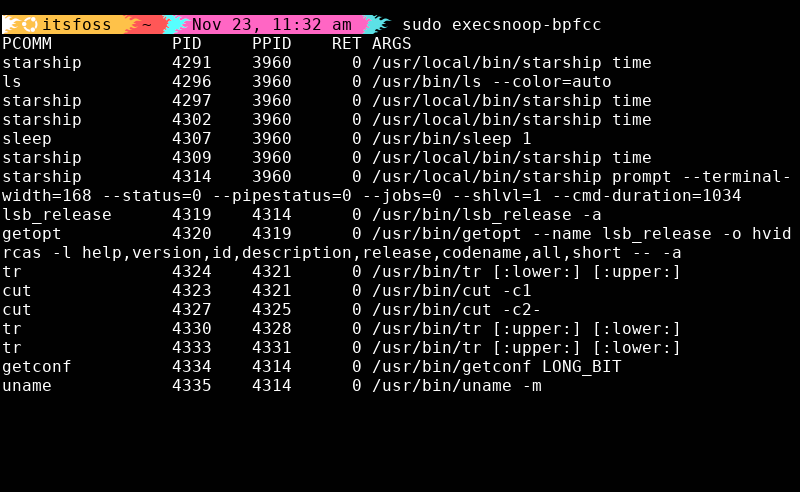
Some processes spawn and die so fast that ps never has a chance to show them.
Cron jobs, failing scripts, runaway children, execsnoop catches them all.
sudo execsnoop-bpfccWhenever I suspect a service is forking out of control or spawning aggressive, short-lived processes, this is the first tool I reach for.
3. opensnoop: Permission denied demystified
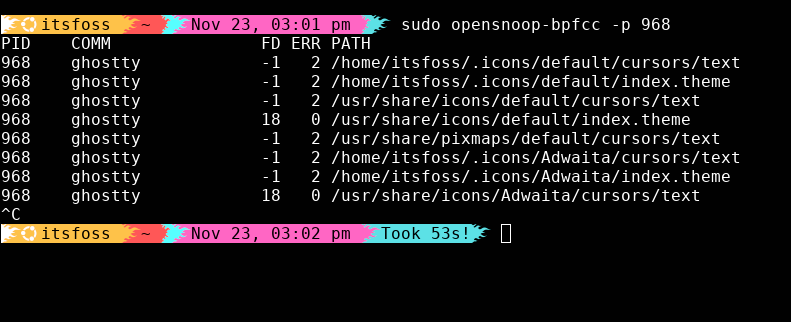
Applications often give you vague errors like “file not found” or “permission denied,” without telling you what file they’re actually talking about.
opensnoop answers that question instantly:
sudo opensnoop-bpfcc -p <PID>You’ll see every file the process tries to open, whether it succeeds or fails, and the exact error code. It’s the fastest way to debug broken config files, missing libraries, incorrect working directories, you name it.
4. tcplife: Tracing microservice sessions
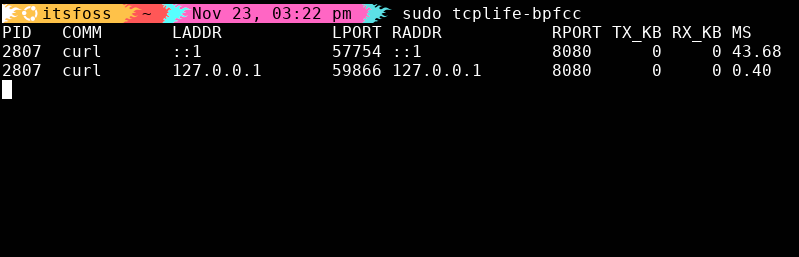
In microservice environments, most TCP sessions last milliseconds. If one suddenly takes 500 ms, your whole stack feels it.
tcplife shows you the duration of every TCP session as it closes:
sudo tcplife-bpfcc
No packet captures. No walls of text. Just clean summaries of connection lifetimes and endpoints. It’s my go-to tool for latency spikes between internal services.
5. gethostlatency: Fixing intermittent slowness
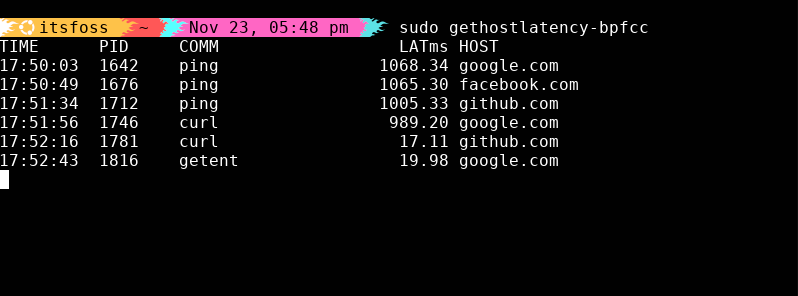
Half of the “network is slow” problems I’ve debugged were actually DNS delays.
gethostlatency traces every hostname resolution:
sudo gethostlatency-bpfccIf you start seeing ~1000 ms DNS lookups, it’s usually a bad resolver in /etc/resolv.conf, a dead VPN DNS server, IPv6 fallback delays, or simply a slow DNS service.
No more guessing. The output tells you exactly which process is waiting on which hostname.
6. biotop: Disk I/O task manager
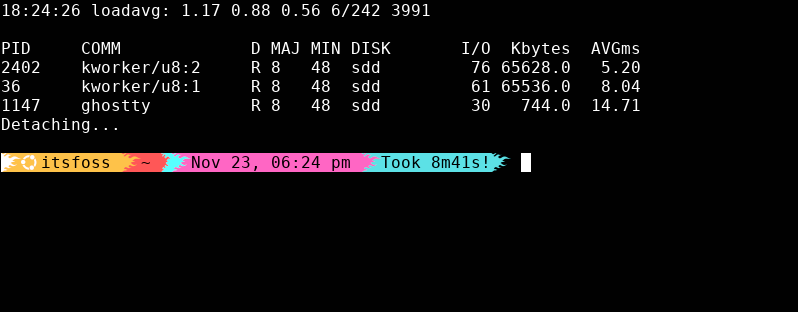
If your system feels sluggish, disk I/O is often the real culprit, not CPU, not RAM.
biotop gives you a real-time, updating list of processes doing disk reads/writes:
sudo biotop-bpfcc
It’s an instant way to catch noisy neighbors on your storage, from runaway databases to log services eating your disks alive.
7. biolatency: The I/O performance historian
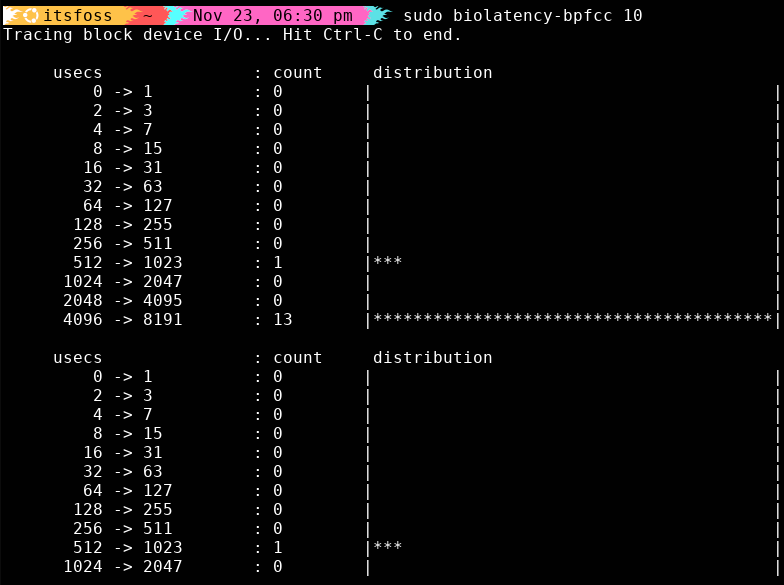
biolatency shows you exactly how long your disk takes to handle I/O, grouped into latency buckets.
The histogram is extremely handy:
sudo biolatency-bpfcc 10
If your I/O starts piling up in the higher-latency buckets, that’s your sign. Your storage stack needs attention.
8. tcpretrans: Spotting network reliability issues
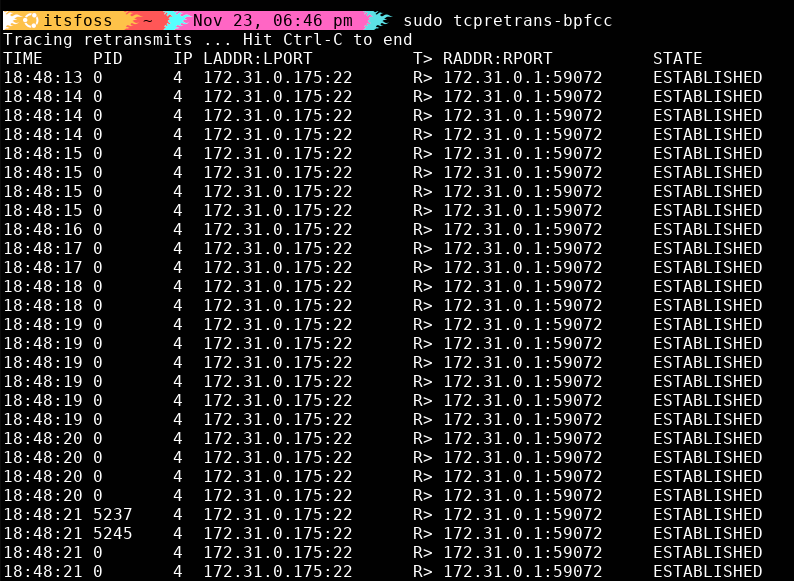
TCP retransmissions happen when the network drops packets. Normally? Hard to see.tcpretrans Shows you every one:
sudo tcpretrans-bpfccEach event shows PID, connection, when it happened, current TCP state.
If your network team is insisting everything is “fine,” tcpretrans is how you politely prove it isn’t.
9. tcpconnect: Tracing outbound connections
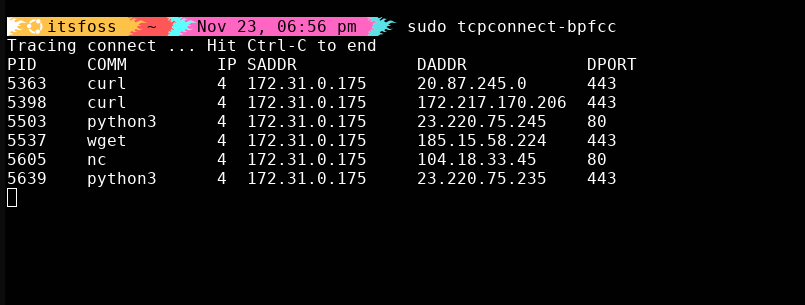
If you’ve ever gotten a security alert about “suspicious outbound traffic,” this tool is your detective:
sudo tcpconnect-bpfcc
Watch outbound connections appear in real time and instantly spot anything that looks… “off.” 👀
Fantastic for debugging microservices, auditing unknown traffic, catching malware or confirming an app talks to the right endpoints.
10. tcpaccept: Tracing inbound connections
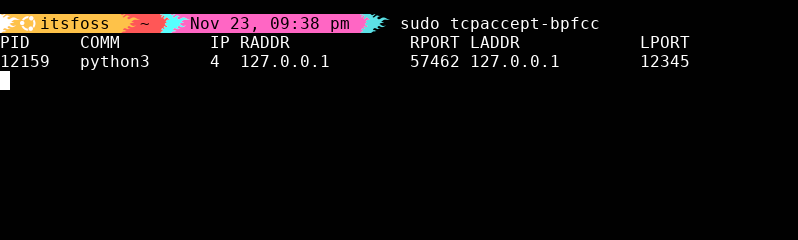
In contrast to tcpconnect, tcpaccept traces inbound connections as they land on your system, making it perfect for debugging load balancer behavior or verifying firewall rules.
sudo tcpaccept-bpfcc
You’ll see inbound connections appear in real-time, making it super easy to spot misrouted traffic or rogue services grabbing traffic they shouldn’t be. ✨
11. biosnoop: I/O operations in detail

When you need a microscope for block I/O, biosnoop is the way:
sudo biosnoop-bpfcc
You get device, sector, latency, PID and size.
It’s too verbose for everyday use, but irreplaceable when debugging low-level storage weirdness.
12. bpftool: Inspect and debug eBPF programs already running
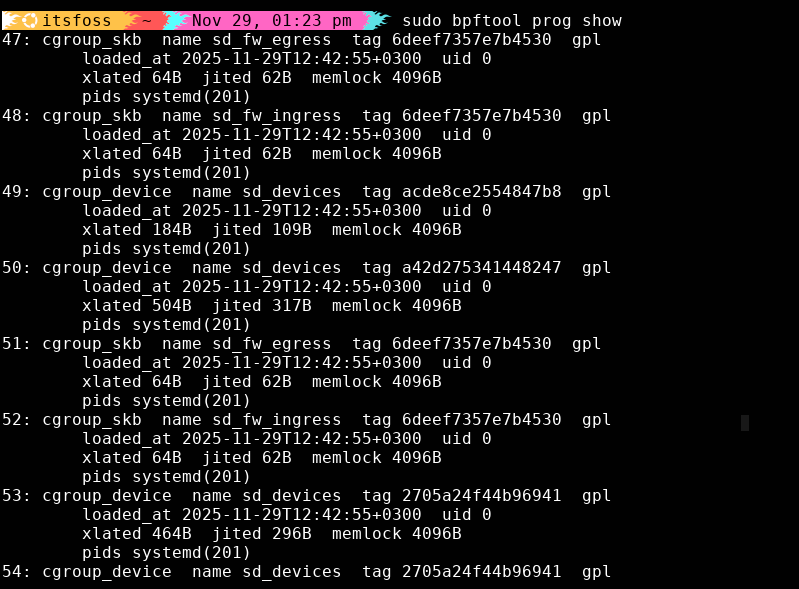
Most eBPF tools run tracing programs. bpftool shows you what’s already running, which is helpful when debugging a system that already has monitoring agents, security tools, or custom eBPF programs loaded. If you want to understand your system’s eBPF state, this is the tool.
List All Loaded eBPF Programs:
sudo bpftool prog showYou can immediately see program IDs, type (tracing, kprobe, xdp, etc.), what it’s attached to, memory usage and when it loaded.
If a mystery program shows up? Now you know where to look for.
Wrapping Up
We can continue debating if sysadmin is still a viable career choice or not but one thing we all can agree on is that everyone needs to adapt and improve their skill sets, even the most seasoned sysadmins.
Classic Linux tools are always there, but eBPF is the natural upgrade as it looks directly in the kernel. Once you start using these tools, it’s hard to imagine managing Linux systems without them.